
Microsoft’s AI spending is showing up in more than revenue growth. In fiscal 2026, the company generated substantially more cash from operations, but it also spent far more cash on property and equipment as it expanded the infrastructure behind Azure and AI services.
That combination makes Microsoft free cash flow especially useful to watch. Revenue rose to $331.839 billion and operating cash flow reached $182.935 billion, yet calculated free cash flow declined because cash additions to property and equipment increased much faster.
Microsoft generated $182.935 billion in operating cash flow in FY2026, up from $136.162 billion in FY2025. Cash additions to property and equipment, however, jumped from $64.551 billion to $115.948 billion. Using operating cash flow minus those cash investments, calculated FCF fell to $66.987 billion and FCF margin declined to about 20.2%.
Microsoft Free Cash Flow: What Changed in FY2026?
The decline in free cash flow did not come from weaker operating cash generation. Microsoft produced considerably more cash from its business in FY2026. The bigger change occurred on the investment side of the cash flow statement.
| Metric | FY2025 | FY2026 | Change |
|---|---|---|---|
| Revenue | $281.724B | $331.839B | +17.8% |
| Operating cash flow | $136.162B | $182.935B | +34.4% |
| Cash additions to PP&E | $64.551B | $115.948B | +79.6% |
| Calculated FCF | $71.611B | $66.987B | -6.5% |
| Calculated FCF margin | 25.4% | 20.2% | -5.2 pp |
The comparison uses Microsoft’s fiscal years ended June 30, 2025 and June 30, 2026. Microsoft reported FY2026 revenue of $331.839 billion, net cash from operations of $182.935 billion, and $115.948 billion of cash additions to property and equipment. The underlying figures are available in Microsoft’s FY2026 fourth-quarter and full-year results.
Operating Cash Flow Was Not the Problem
Revenue increased from $281.724 billion in FY2025 to $331.839 billion in FY2026, an increase of about 17.8%. Operating cash flow moved even faster, rising from $136.162 billion to $182.935 billion, or roughly 34.4%.
That distinction matters. Looking only at the decline in FCF could create the impression that Microsoft’s underlying cash generation weakened. The cash flow statement shows the opposite: the business generated much more operating cash during the year.
Operating cash flow was equivalent to roughly 55.1% of FY2026 revenue. That ratio is not a substitute for margins or earnings analysis, but it provides useful context when evaluating whether revenue growth is translating into cash.
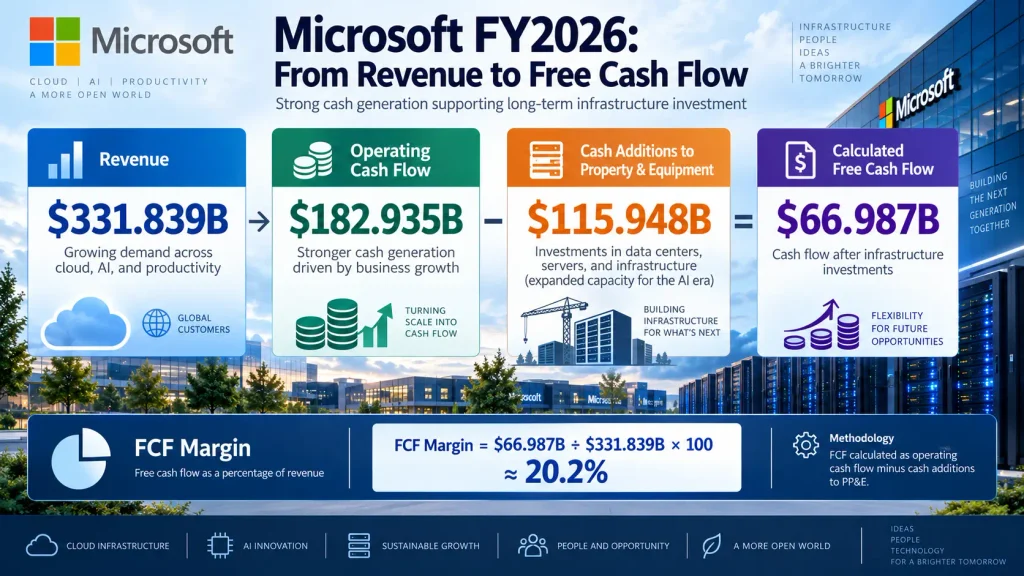
Microsoft generated $182.935 billion in operating cash flow in FY2026 and spent $115.948 billion in cash on property and equipment. Using OCF minus those cash additions to PP&E produces calculated FCF of $66.987 billion, or about 20.2% of revenue.
AI Infrastructure Spending Changed the Cash Flow Picture
The more dramatic change was Microsoft’s investment in property and equipment. Cash additions to PP&E increased from $64.551 billion in FY2025 to $115.948 billion in FY2026, an increase of approximately 79.6%.
That growth rate was far above the 17.8% increase in revenue and the 34.4% increase in operating cash flow. It explains why stronger operating cash generation did not translate into higher free cash flow under the methodology used here.
There is an important accounting distinction, however. The $115.948 billion figure comes from the cash flow statement line item Additions to property and equipment. It should not automatically be treated as identical to every broader definition of capital expenditures.
It also should not be described as entirely AI or GPU spending. Microsoft’s infrastructure investment spans data centers and the equipment required to support cloud and AI workloads, including buildings, servers, CPUs, GPUs, and networking equipment.
Microsoft provided additional context during its FY2026 Q4 earnings conference call. Management said total capital expenditures for the quarter were $41 billion, with roughly two-thirds spent on short-lived assets, primarily CPUs and GPUs.
The difference between that $41 billion total-capex figure and the quarter’s $35.802 billion of cash additions to PP&E is also a useful reminder that cash spending and broader capex measures are not always interchangeable.
Calculating Microsoft’s FY2026 Free Cash Flow
Free cash flow is not a standardized GAAP line item, so definitions can vary among companies and financial-data providers. For a consistent year-over-year comparison, this analysis uses a straightforward cash-flow-statement approach:
For a broader explanation of the relationship between capital spending and free cash flow, including the difference between maintenance and growth investment, see How CapEx Affects Free Cash Flow: Maintenance vs. Growth CapEx Explained.
Free Cash Flow = Operating Cash Flow – Cash Additions to Property and Equipment
For FY2026:
$182.935B – $115.948B = $66.987B
Applying the same method to FY2025:
$136.162B – $64.551B = $71.611B
On that basis, calculated Microsoft free cash flow declined about 6.5% year over year, even though operating cash flow increased more than 34%.
The fourth quarter illustrates the same dynamic on a shorter time frame. Microsoft reported $55.441 billion of operating cash flow and $35.802 billion of cash additions to property and equipment. The difference is approximately $19.639 billion, consistent with the company’s discussion of roughly $19.6 billion in quarterly free cash flow.

Revenue and operating cash flow both increased in FY2026, but cash additions to property and equipment rose much faster. Calculated FCF declined 6.5%, while FCF margin moved from about 25.4% to 20.2%, highlighting the cash-flow impact of Microsoft’s investment cycle.
Why Microsoft’s FCF Margin Fell to 20.2%
Absolute FCF is useful, but Microsoft’s size makes it helpful to compare free cash flow with revenue. FCF margin provides that additional perspective.
FCF Margin = Free Cash Flow ÷ Revenue × 100
For FY2025:
$71.611B ÷ $281.724B × 100 ≈ 25.4%
For FY2026:
$66.987B ÷ $331.839B × 100 ≈ 20.2%
The result is a decline of about 5.2 percentage points. Revenue expanded, but a larger share of the cash generated by the business was being reinvested in property and equipment.
A falling FCF margin does not, by itself, show that Microsoft’s competitive position deteriorated. In this case, operating cash flow was growing strongly while infrastructure spending grew even faster. At the same time, calling the decline irrelevant because the spending supports future growth would go too far. Large investments eventually need to produce economic returns.
If you want to review the metric before applying it to Microsoft, see our free cash flow margin guide, which explains how operating cash flow, capital expenditures, revenue, and FCF margin fit together.
What Investors Can Monitor Next
The first comparison worth tracking is the growth rate of operating cash flow versus infrastructure spending. FY2026 was unusual in the size of the gap: operating cash flow increased about 34.4%, while cash additions to PP&E increased about 79.6%. If capital spending continues to outpace cash generation, FCF could remain under pressure even with healthy revenue growth.
The second question is monetization. Data centers and computing equipment are inputs, not investment outcomes. The longer-term test is whether Azure and Microsoft’s AI products can generate enough incremental revenue and cash flow to justify the capital required to support them.
Third, annual trends deserve more weight than a single quarter. Data-center projects, equipment purchases, and the timing of cash payments can create substantial quarter-to-quarter variation. Tracking the same FCF methodology across several reporting periods provides a cleaner view of how the investment cycle is evolving.
Free cash flow shows how much cash remains after investment, but it does not by itself measure how efficiently Microsoft is using the capital committed to its business. Our Microsoft ROE vs. ROIC analysis extends this framework by examining capital efficiency and returns on invested capital.
What the FY2026 numbers show
Microsoft’s operating cash generation strengthened materially, but cash infrastructure investment expanded even faster. The result was lower calculated FCF and a lower FCF margin despite higher revenue. Whether that trade-off creates attractive long-term economics depends on the future cash returns generated by the infrastructure being built today.
Is Microsoft’s Lower Free Cash Flow a Warning Sign?
The FY2026 data do not support a simple yes-or-no conclusion. Microsoft increased both revenue and operating cash flow substantially while committing much more capital to cloud and AI infrastructure.
That creates two competing forces in the cash flow statement. The existing business is producing more cash, while the investment program is consuming more of it. Free cash flow sits between those two forces.
If Azure and AI-related services generate enough incremental revenue and operating cash flow, today’s lower FCF margin may prove to be part of a capital-intensive expansion period. If investment remains elevated without a corresponding increase in future cash generation, the economics of that spending would warrant closer scrutiny.
For that reason, future Microsoft earnings reports can be read as a sequence rather than as isolated headline numbers: revenue growth → operating cash flow → cash infrastructure spending → free cash flow → FCF margin.
A Note on Microsoft’s Capex and FCF Definitions
Investors comparing Microsoft with financial websites may encounter different FCF or capex figures. That does not necessarily mean one source is wrong.
Free cash flow is a non-GAAP measure without one universally required calculation. Likewise, management’s discussion of total capital expenditures can differ from cash additions to property and equipment because of items such as finance leases and the timing of cash payments.
This article therefore uses one definition consistently for both fiscal years: operating cash flow minus cash additions to property and equipment. Consistency matters more than switching methodologies to obtain a particular result.
Frequently Asked Questions
How much free cash flow did Microsoft generate in FY2026?
Using operating cash flow minus cash additions to property and equipment, Microsoft generated approximately $66.987 billion of calculated free cash flow in FY2026. The calculation uses $182.935 billion of operating cash flow and $115.948 billion of cash additions to PP&E. Other data providers may report a different figure if they use a different FCF definition.
Why did Microsoft free cash flow decline even though revenue increased?
Revenue increased about 17.8% and operating cash flow increased about 34.4%, but cash additions to property and equipment rose approximately 79.6%. Under the calculation used here, that faster growth in cash infrastructure investment pushed FCF from $71.611 billion in FY2025 to $66.987 billion in FY2026.
Does lower FCF mean Microsoft’s AI investments are failing?
No conclusion like that can be drawn from FCF alone. FY2026 shows that Microsoft generated more operating cash while simultaneously investing much more heavily in infrastructure. Evaluating the outcome requires watching whether those investments contribute to additional Azure, AI, revenue, and cash-flow growth over future reporting periods.
The Bottom Line
Microsoft’s FY2026 cash flow statement captures the financial tension at the center of the AI investment cycle. Revenue reached $331.839 billion and operating cash flow climbed to $182.935 billion, but cash additions to property and equipment rose to $115.948 billion.
Using a consistent OCF-minus-cash-PP&E methodology, calculated free cash flow declined to $66.987 billion from $71.611 billion a year earlier. FCF margin consequently moved from about 25.4% to 20.2%.
The decline is more informative when viewed alongside the surge in capital spending rather than in isolation. Microsoft’s business generated more cash in FY2026; it also reinvested much more of that cash. Future results will show whether the revenue and operating cash flow produced by the expanded AI and cloud infrastructure ultimately keep pace with the capital required to build it.
This article is for educational and research purposes only and does not constitute investment advice or a recommendation to buy or sell Microsoft or any other security. Financial figures are based on Microsoft public disclosures for the periods discussed. Free cash flow is not a standardized GAAP metric, and calculation methods may differ across companies and data providers. Investors should review current filings and consider their own objectives and risk tolerance before making investment decisions.