
Revenue growth can make a business look stronger at first glance, but sales alone do not tell investors how much cash ultimately remains after the company funds its operations and capital spending.
Free cash flow margin adds that missing perspective. It measures free cash flow as a percentage of revenue, giving investors a practical way to see how effectively sales are being converted into cash after capital expenditures.
If a company generates $100 of revenue and $15 of free cash flow, its FCF margin is 15%. The calculation is simple. The interpretation requires more context.
Free cash flow margin measures how much free cash flow a business generates relative to its revenue. It is most useful when investors compare consistent definitions across time and against businesses with similar capital requirements.
How to Calculate Free Cash Flow Margin
The basic free cash flow margin formula is:
Free Cash Flow Margin = Free Cash Flow ÷ Revenue × 100
Before using the formula, investors need a free cash flow figure. A common starting point is:
Free Cash Flow = Operating Cash Flow – Capital Expenditures
If you want to understand why capital spending can reduce current-period free cash flow without automatically signaling weaker business economics, see how CapEx affects free cash flow, including the distinction between maintenance and growth CapEx.
Consider a hypothetical company with $100 of revenue. It generates $25 of operating cash flow and spends $10 on capital expenditures.
| Metric | Illustrative Amount | What It Represents |
|---|---|---|
| Revenue | $100 | Total sales during the period |
| Operating Cash Flow | $25 | Cash flow generated from operating activities |
| Capital Expenditures | $10 | Cash invested in property, equipment, and other capital assets |
| Free Cash Flow | $25 – $10 = $15 | FCF under the basic OCF-minus-CapEx approach |
| Free Cash Flow Margin | $15 ÷ $100 × 100 = 15% | $15 of FCF per $100 of revenue |
In this example, 15% of revenue translates into free cash flow under the stated calculation. That gives investors information that revenue growth by itself cannot provide.
There is an important accounting limitation, however. Free cash flow is not a standardized GAAP subtotal with one mandatory definition. Operating cash flow minus capital expenditures is widely used, but companies may report adjusted versions that exclude or include additional items.
Before comparing FCF margins, check how each company defines free cash flow and make sure the revenue and cash-flow figures cover the same reporting period. For readers who want to review the underlying cash-flow mechanics first, the Smart Asset Desk free cash flow guide explains how operating cash flow and capital spending fit together.
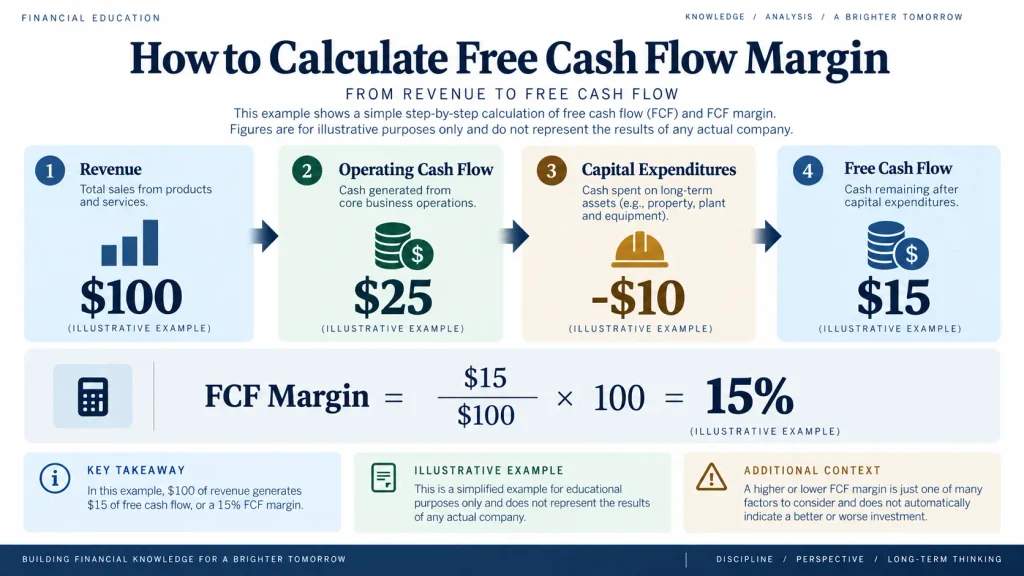
Illustrative example: $25 of operating cash flow minus $10 of capital expenditures produces $15 of free cash flow. Relative to $100 of revenue, the resulting FCF margin is 15%. These figures are hypothetical and are not actual company results.
What Free Cash Flow Margin Actually Tells Investors
A 15% FCF margin does not mean the company earned a 15% net profit margin. It means that, under the FCF definition being used, free cash flow represented 15% of revenue during that period.
That distinction matters because the income statement and cash flow statement answer different questions. Accounting earnings include accruals and non-cash items, while operating cash flow reflects actual cash movements from operating activities. Capital expenditures then capture cash that must be reinvested in assets such as factories, equipment, servers, stores, or network infrastructure.
FCF margin brings those pieces together by asking a practical question: after operating cash generation and capital spending, how much free cash flow did the company produce for each dollar of revenue?
FCF margin should not be confused with the free cash flow conversion ratio. FCF margin uses revenue as its denominator, while the net-income-based conversion ratio compares free cash flow with accounting earnings. Apple’s FY2024–FY2025 results illustrate why these two measures answer different financial questions.
This makes the metric particularly useful when revenue is growing quickly but investors want to know whether that growth is translating into cash.
The Same Revenue Can Produce Very Different FCF Margins
Two companies can report identical revenue and still have very different cash-generation profiles.
Suppose two hypothetical businesses each generate $100 of revenue. Company A produces $20 of free cash flow, while Company B produces only $5.
| Metric | Company A | Company B |
|---|---|---|
| Revenue | $100 | $100 |
| Free Cash Flow | $20 | $5 |
| FCF Margin | 20% | 5% |
| FCF per $100 of Revenue | $20 | $5 |
Company A converts a larger share of its revenue into free cash flow under these assumptions. That does not automatically make Company A the better investment.
Business models have very different capital requirements. A software company may require relatively little spending on physical assets, while a semiconductor manufacturer, utility, telecom operator, or industrial company may need substantial recurring capital expenditures simply to maintain and expand its operations.
That is why cross-industry FCF margin rankings can be misleading. The metric usually becomes more informative when investors compare a company with its own history or with peers that have reasonably similar business economics.
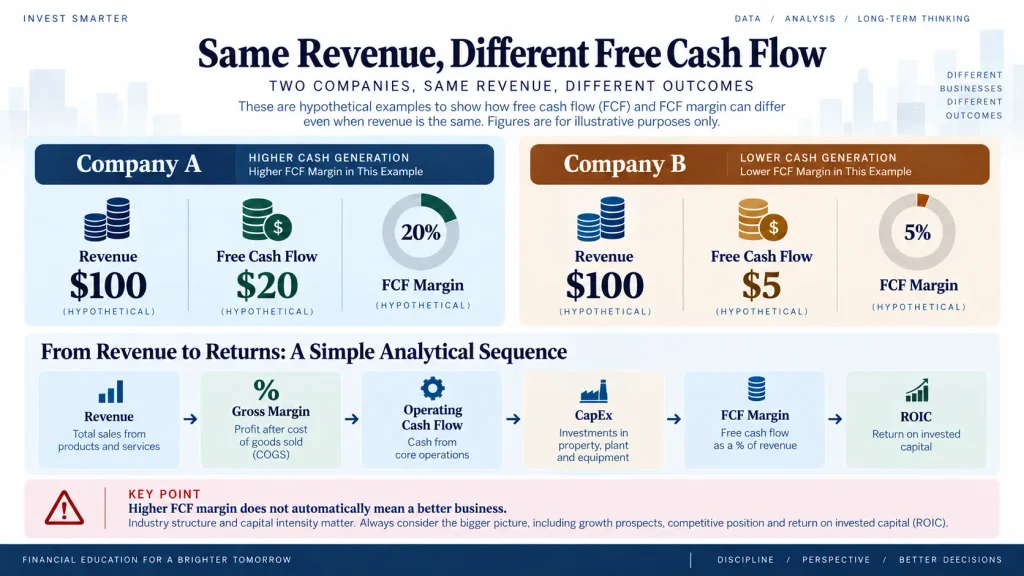
Illustrative comparison: both hypothetical companies generate $100 of revenue, but Company A produces $20 of FCF while Company B produces $5. The difference highlights cash conversion, not an automatic judgment about business quality; industry economics and capital requirements still matter.
Why One Year of FCF Margin Can Be Misleading
Free cash flow can move sharply even when the underlying business has not changed as dramatically as the headline percentage suggests.
Capital expenditures are one reason. A company building a new factory, data center, distribution network, or production line may report lower FCF during an investment cycle. The resulting FCF margin can fall even if revenue and operating performance remain healthy.
Working capital can also create temporary swings. Faster customer collections may lift operating cash flow, while rising receivables or inventory can consume cash. Payment timing can therefore make one reporting period look unusually strong or weak.
For that reason, a multi-year FCF margin trend often tells investors more than one isolated annual percentage. When the margin changes materially, look at operating cash flow, working capital, and capital expenditures separately before deciding what caused the move.
Microsoft’s FY2026 results provide a real-world example of this dynamic. Operating cash flow increased substantially, but cash additions to property and equipment grew even faster, pushing calculated FCF margin lower under a consistent OCF-minus-cash-CapEx approach. See our Microsoft free cash flow analysis for the full FY2025-to-FY2026 comparison.
FCF Margin vs. Gross Margin: Different Parts of the Business
Gross margin and free cash flow margin both use revenue as a denominator, but they measure different stages of a company’s economics.
| Metric | Basic Calculation | Primary Question |
|---|---|---|
| Gross Margin | Gross Profit ÷ Revenue | How much revenue remains after direct cost of goods or services? |
| Operating Margin | Operating Income ÷ Revenue | How profitable are core operations after operating expenses? |
| Net Margin | Net Income ÷ Revenue | How much accounting profit remains after all recognized expenses? |
| FCF Margin | Free Cash Flow ÷ Revenue | How much free cash flow is generated relative to sales? |
Gross margin sits relatively high on the income statement. It can help investors analyze pricing, direct production costs, and product mix. Free cash flow margin reaches further into the economics of the business because cash conversion and capital spending affect the result.
A company can therefore have a high gross margin but a much lower FCF margin if working capital consumes cash or the business requires substantial capital investment.
The reverse relationship can also change over time. Stable gross margins combined with improving working-capital efficiency or lower capital requirements may allow FCF margin to rise.
For a deeper look at the first part of that chain, How to Analyze Gross Margin breaks margin changes into price, volume, cost, and product mix rather than treating the reported percentage as a standalone signal.
A Real-World Example: Fortinet’s FY2025 FCF Margin
Fortinet provides a useful example of why investors should read a company’s own FCF definition instead of assuming that every reported free cash flow number is calculated identically.
For the fiscal year ended December 31, 2025, Fortinet reported revenue of $6.7996 billion and net cash provided by operating activities of $2.5906 billion. The company also reported non-GAAP free cash flow of $2.2118 billion.
| Fortinet FY2025 | Reported Amount |
|---|---|
| Revenue | $6.7996B |
| Operating Cash Flow | $2.5906B |
| Company-Defined Non-GAAP FCF | $2.2118B |
| FCF Margin | Approximately 32.5% |
Dividing $2.2118 billion of FCF by $6.7996 billion of revenue produces an FCF margin of approximately 32.5%, consistent with the company’s reported measure.
Fortinet’s definition is important. Its free cash flow is a non-GAAP measure, and the company provides a reconciliation explaining the adjustments used in arriving at that figure.
Fortinet’s FY2025 reconciliation provides a useful illustration of why the definition matters. The company reported $2,590.6 million in operating cash flow and $364.8 million in purchases of property and equipment. It also excluded $14.0 million in proceeds from an intellectual property matter. The reconciliation is therefore $2,590.6M − $364.8M − $14.0M = $2,211.8M of company-defined non-GAAP free cash flow. Dividing that amount by $6,799.6 million in revenue produces an FCF margin of approximately 32.5%. Without reviewing the adjustment, an investor using only OCF minus property and equipment purchases would calculate a different figure.
Investors comparing Fortinet with another cybersecurity company should therefore check whether the peer uses the same FCF methodology before treating the two percentages as directly comparable.
The underlying figures and reconciliation are available in Fortinet’s FY2025 Form 10-K filed with the SEC.
Three Questions to Ask Before Comparing FCF Margins
First, are the FCF definitions consistent? Because free cash flow is non-GAAP, two companies can use slightly different adjustments. Comparing percentages without reading the definitions can create false precision.
Second, what caused capital expenditures to change? Lower CapEx can improve FCF margin, but the reason matters. It may reflect a business that has completed a major investment cycle, or it may indicate that necessary spending has simply been delayed.
Third, is the change persistent? Working-capital movements and investment timing can distort individual quarters or years. A multi-period trend helps separate recurring cash economics from temporary fluctuations.
FCF Margin Does Not Measure Capital Efficiency
FCF margin tells investors how much free cash flow a company produces relative to revenue. It does not tell them how much capital the business required to generate those sales and cash flows.
Consider two companies that both report a 15% FCF margin. One may require relatively little invested capital, while the other needs billions of dollars tied up in factories, equipment, inventory, or network assets.
This is where return on invested capital can add another dimension. ROIC asks whether the business is generating attractive operating returns relative to the capital committed to the enterprise.
A useful analytical sequence is:
Revenue Growth → Gross Margin → Operating Cash Flow → CapEx → Free Cash Flow → FCF Margin → ROIC
The sequence is not a rigid scoring system. It is a way to move from top-line growth toward increasingly demanding questions about profitability, cash conversion, reinvestment, and capital efficiency.
The Smart Asset Desk ROIC guide continues that analysis by examining how efficiently a company uses the capital invested in its operations.
A Practical Way to Use FCF Margin During Earnings Analysis
When reviewing a 10-K, 10-Q, or earnings release, start by making sure the revenue and cash-flow figures cover the same period. Mixing annual revenue with quarterly free cash flow will produce a meaningless margin.
- Find revenue for the period being analyzed.
- Locate net cash provided by operating activities on the cash flow statement.
- Identify capital expenditures and confirm how the company defines them.
- Calculate FCF using a consistent methodology, or use the company’s reported FCF after reviewing its reconciliation.
- Divide FCF by revenue to calculate FCF margin.
- Repeat the calculation for several comparable periods.
- Investigate changes in operating cash flow, working capital, and CapEx.
- Compare the result with similar businesses rather than unrelated industries.
If management reports an adjusted FCF measure, do not automatically mix it with a basic operating-cash-flow-minus-CapEx calculation from another company. Consistency matters more than choosing whichever version produces the highest margin.
Frequently Asked Questions
What is a good free cash flow margin?
There is no universal percentage that defines a good FCF margin across all industries. Capital-light businesses can naturally produce very different margins from utilities, telecom companies, manufacturers, or semiconductor businesses. Historical trends and comparisons with economically similar peers usually provide more useful context than a single cutoff.
Is free cash flow margin the same as net profit margin?
No. Net profit margin compares accounting net income with revenue. FCF margin compares free cash flow with revenue. Non-cash expenses, working-capital movements, and capital expenditures can cause the two measures to differ substantially.
Does a falling FCF margin mean the business is getting worse?
Not necessarily. FCF margin can decline because operating cash generation weakened, but it can also fall because the company increased capital spending for future growth or experienced temporary working-capital outflows. The underlying cash-flow components need to be examined before interpreting the decline.
The Bottom Line
Free cash flow margin turns an absolute cash-flow number into a revenue-based measure of cash conversion. If a company generates $15 of free cash flow from $100 of revenue, its FCF margin is 15%.
The percentage becomes more useful when investors look beyond the formula. Changes in operating cash flow, working capital, and capital expenditures can all move FCF margin, and different industries operate with very different capital requirements. Company-defined FCF measures can also differ.
Rather than treating FCF margin as a standalone quality score, use it as one step in a broader financial-statement analysis. Revenue shows the size of the business, gross margin provides information about product economics, FCF margin tests cash conversion after capital spending, and ROIC adds the question of how efficiently the company uses invested capital.
Investment Disclaimer
This article is for educational and informational purposes only and does not constitute investment advice or a recommendation to buy or sell any security. Free cash flow is a non-GAAP measure whose definition may vary by company. Investors should review the latest SEC filings, company disclosures, and reconciliation tables before making investment decisions. All investments involve risk, including the possible loss of principal.