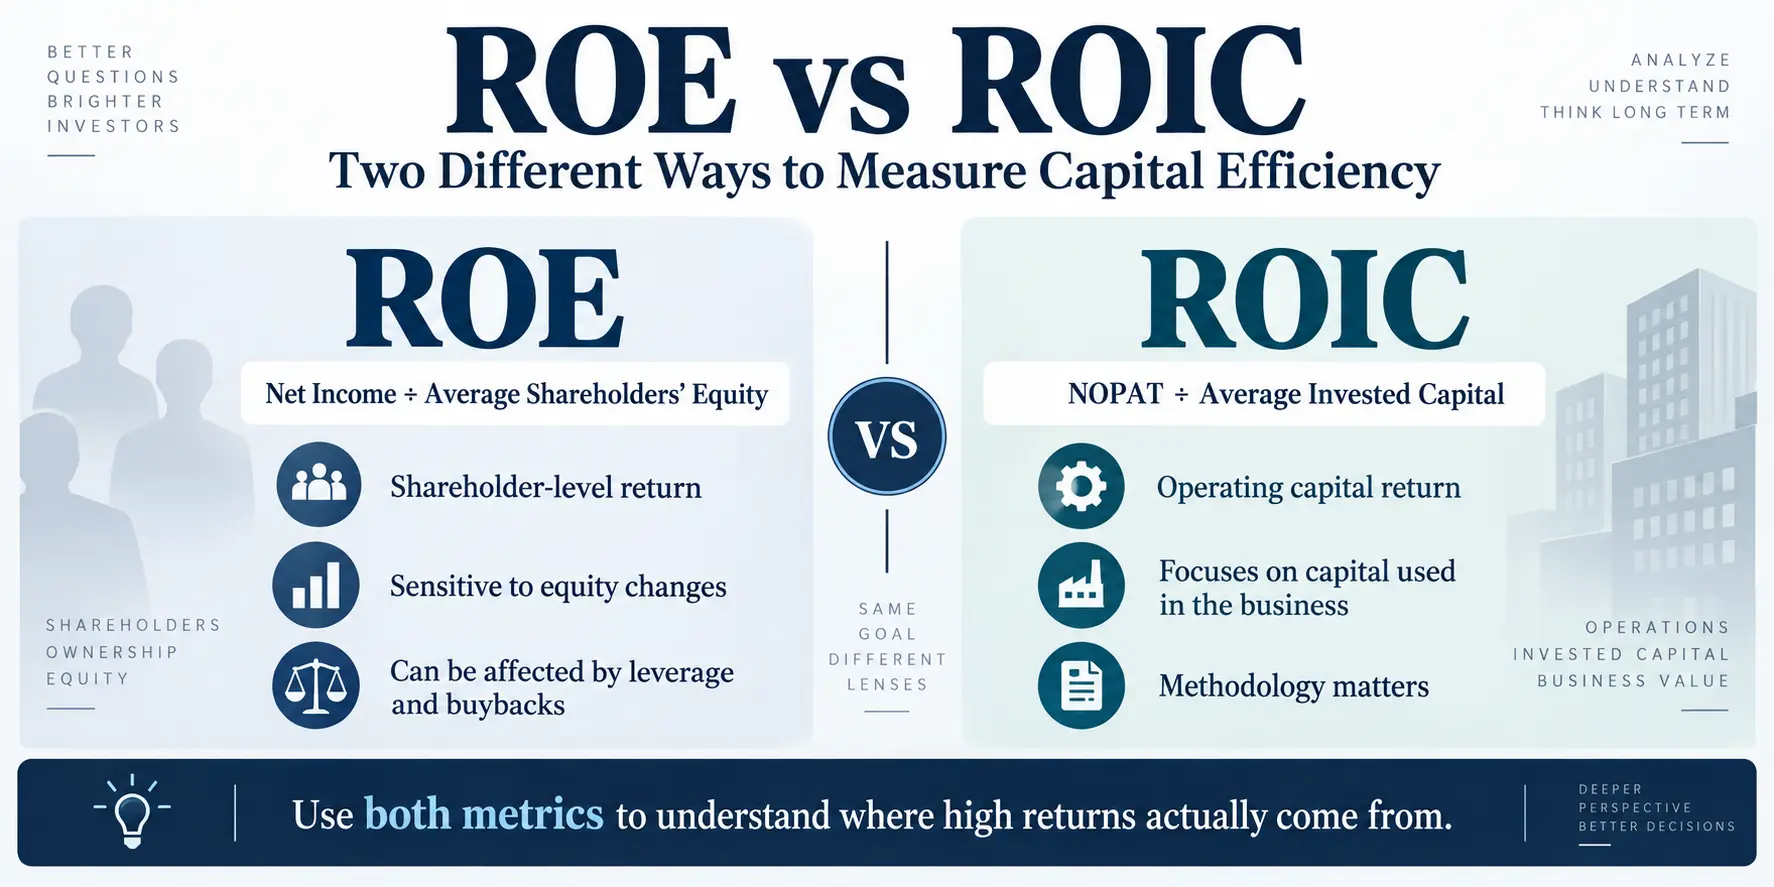
ROE vs ROIC helps investors separate shareholder-level profitability from the return generated by the operating capital inside a business. ROE measures net income relative to shareholders’ equity. ROIC instead compares after-tax operating profit with the capital committed to operations. Looking at both can reveal whether a high return comes primarily from strong operating economics or from changes in leverage, share repurchases, and the size of book equity.
Neither ratio should be treated as a standalone quality score. ROE can move sharply when equity changes, while ROIC can vary depending on how invested capital, excess cash, goodwill, leases, and taxes are defined. The most useful approach is to calculate each metric consistently, compare the trend across multiple periods, and then connect ROIC with the company’s cost of capital.
For the cash-flow side of this analysis, the Smart Asset Desk Free Cash Flow Guide explains how operating cash flow, capital expenditures, and reported earnings answer different questions.
ROE vs ROIC: The Core Difference
| Question | ROE | ROIC |
|---|---|---|
| What does it measure? | Net income earned relative to shareholders’ equity | After-tax operating profit earned relative to invested operating capital |
| Common formula | Net Income ÷ Average Shareholders’ Equity | NOPAT ÷ Average Invested Capital |
| Why can leverage matter? | Debt and buybacks can change the equity denominator and net income | Financing effects are reduced, but the result still depends on the invested-capital definition |
| What should investors check? | Net income quality, equity changes, leverage, and repurchases | NOPAT definition, cash adjustments, goodwill, debt, leases, and consistency across periods |
ROE is commonly calculated as:
ROE = Net Income ÷ Average Shareholders’ Equity
This ratio is useful because shareholders ultimately care about the profit generated on their capital. But the denominator can change for reasons that have little to do with improving operations.
For example, a large share repurchase can reduce book equity. If net income remains stable while equity declines, ROE can rise even if the operating business has not become more productive. Additional debt can also affect ROE, but the direction is not automatic because higher borrowing can increase both assets and interest expense.
Why ROIC Adds a Different Layer
ROIC shifts the analysis from shareholder accounting returns toward the economics of the operating business.
A common simplified formula is:
ROIC = NOPAT ÷ Average Invested Capital
NOPAT means Net Operating Profit After Tax. A simplified starting point is:
NOPAT ≈ EBIT × (1 − Tax Rate)
Invested capital is more methodology-sensitive. A common approach starts with debt and equity capital and adjusts for cash and other assets not required for core operations. Another approach builds invested capital from operating assets minus non-interest-bearing operating liabilities.
That is why two financial-data providers can report different ROIC figures for the same company without either calculation necessarily being an arithmetic error. The difference may come from how they treat cash, goodwill, acquired intangibles, leases, tax adjustments, or average versus ending balances.
For trend analysis, consistency matters more than selecting whichever methodology produces the highest ROIC. Investors should use the same definition from period to period and investigate large jumps rather than assuming every increase reflects stronger economics.
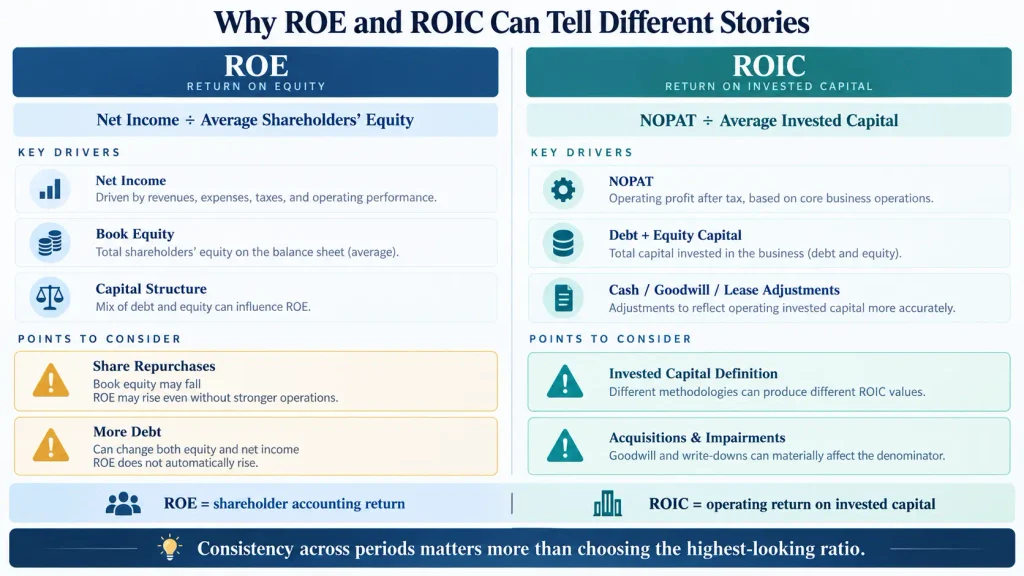
ROE and ROIC answer different questions. ROE can change sharply when book equity changes, while ROIC depends on how NOPAT and invested capital are defined. The comparison is intended to explain the mechanics of the two ratios, not to imply that one metric is always superior.
ROIC vs WACC: When Capital Efficiency Becomes Economic Value
ROIC becomes more useful when it is compared with the company’s estimated cost of capital.
If ROIC is above WACC, the existing operating capital is generating a return above the estimated hurdle rate. If ROIC remains below WACC for an extended period, additional investment may increase the size of the business without creating equivalent economic value.
There is no universal rule that ROIC must exceed WACC by 5 percentage points, 10 percentage points, or any other fixed spread. WACC itself is an estimate built from the risk-free rate, equity risk premium, beta, debt costs, taxes, and capital structure. A narrow spread can therefore change when reasonable assumptions change.
A wider and persistent positive spread can provide stronger evidence than a one-year result, but investors should also ask what return the next dollar of capital is likely to earn.
The full relationship is covered in the ROIC vs WACC guide, including economic profit, WACC assumptions, marginal ROIC, and capital allocation decisions.
Microsoft FY2026: Why ROE Alone Is Not Enough
Microsoft provides a useful current example because its profitability remains high while the company is also committing far more capital to cloud and AI infrastructure.
According to Microsoft’s FY2026 Form 10-K, GAAP net income for the fiscal year ended June 30, 2026 was $133.749 billion. Total stockholders’ equity increased from $343.479 billion at the end of FY2025 to $442.387 billion at the end of FY2026.
Using those two year-end equity balances as a simple average:
Average Equity = ($343.479B + $442.387B) ÷ 2 = $392.933B
That produces a simple FY2026 ROE of approximately:
FY2026 ROE ≈ $133.749B ÷ $392.933B × 100 = 34.0%
For comparison, FY2025 net income was $101.832 billion, while FY2024 and FY2025 ending equity were $268.477 billion and $343.479 billion. Using the same simple averaging method produces an FY2025 ROE of approximately 33.3%.
| Metric | FY2025 | FY2026 | What It Shows |
|---|---|---|---|
| GAAP Net Income | $101.832B | $133.749B | ROE numerator |
| Simple Average Equity | $305.978B | $392.933B | Average of beginning and ending annual equity |
| Simple ROE | About 33.3% | About 34.0% | High shareholder-level accounting profitability |
| Operating Cash Flow | $136.162B | $182.935B | Operating cash generation increased substantially |
| Cash Additions to PP&E | $64.551B | $115.948B | Cash infrastructure investment increased sharply |
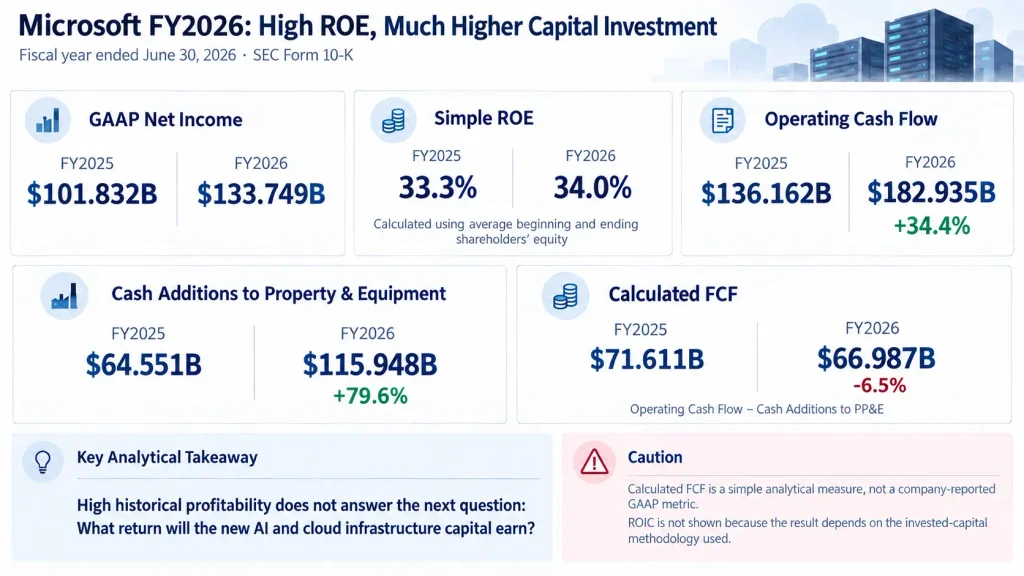
Microsoft’s FY2026 ROE remained high while infrastructure investment accelerated sharply. The calculated FCF used in this article is operating cash flow minus cash additions to property and equipment and is not a company-reported GAAP metric.
The cash-flow comparison adds another layer to the ROE discussion. Microsoft’s operating cash flow increased from $136.162 billion in FY2025 to $182.935 billion in FY2026, an increase of roughly 34.4%. Cash additions to property and equipment increased from $64.551 billion to $115.948 billion, or about 79.6%.
Using the same operating-cash-flow-minus-cash-PP&E methodology for both periods:
FY2025 Calculated FCF = $136.162B − $64.551B = $71.611B
FY2026 Calculated FCF = $182.935B − $115.948B = $66.987B
Calculated free cash flow therefore declined by approximately 6.5% even though operating cash flow increased substantially. Free cash flow is not a standardized GAAP metric, so this calculation should not be treated as the only valid FCF definition. It is used here because the same methodology is applied consistently to both fiscal years.
The Microsoft FY2026 free cash flow analysis examines that investment cycle in more detail, including operating cash flow, cash additions to property and equipment, and the resulting calculated FCF.
For ROIC analysis, the next question is not simply whether Microsoft historically produced high returns. Investors need to evaluate whether the additional capital now being committed to data centers, servers, networking equipment, and AI infrastructure ultimately generates sufficient incremental operating profit and cash flow.
This is where marginal or incremental ROIC becomes more relevant than relying only on a historical average.
This article does not present a single Microsoft ROIC number as the definitive figure because the result depends materially on the invested-capital methodology used. Cash and short-term investments, debt, leases, goodwill, acquired intangibles, and tax normalization can all affect the calculation. A useful comparison requires the same definition across periods.
Four Ways ROE and ROIC Can Mislead Investors
1. Buybacks Can Lift ROE Without Improving Operations
Share repurchases reduce outstanding equity on the balance sheet. If net income remains relatively stable while book equity falls, ROE can increase even if operating margins, pricing power, and cash conversion do not improve.
This does not make buybacks bad. It means ROE should be read alongside the source of the change in shareholders’ equity.
2. Goodwill and Impairments Can Change ROIC
Large acquisitions can increase goodwill and acquired intangible assets, raising the capital base used in some ROIC calculations. Later impairments can reduce that accounting capital base and make subsequent ROIC appear higher even when the underlying business has not improved by the same amount.
When comparing acquisitive companies, investors should check whether goodwill is included in invested capital and use the same treatment for each period or peer.
3. Financial Companies Require a Different Lens
For banks, insurers, and many other financial institutions, debt and financial assets are part of the operating model rather than simply financing choices.
Traditional industrial-company ROIC calculations can therefore be less informative. Depending on the business, ROE, return on tangible common equity, capital ratios, credit quality, and net interest economics may provide more relevant information.
4. A High ROIC Does Not Mean a Stock Is Cheap
ROIC evaluates the economics of the business. It does not determine whether the current share price offers an attractive expected return.
A company can generate exceptional operating returns and still become a poor investment if the purchase price already assumes years of unusually strong future growth. Business quality and valuation are separate questions.
A Practical ROE vs ROIC Research Process
- Calculate ROE using net income and average shareholders’ equity rather than relying only on a data-provider headline.
- Check whether debt issuance, repurchases, acquisitions, or impairments materially changed the balance sheet.
- Define NOPAT and invested capital consistently before calculating ROIC.
- Use the same ROIC methodology across multiple years.
- Investigate large changes instead of automatically treating a higher ROIC as an improvement.
- Compare ROIC with a reasonable WACC range rather than an arbitrary universal hurdle.
- For companies in a major investment cycle, evaluate the expected return on new capital as well as historical ROIC.
- Cross-check capital efficiency with free cash flow and valuation before drawing an investment conclusion.
ROE and ROIC work best as complementary tools. ROE shows what the company earned relative to shareholder equity. ROIC asks whether operating profit is attractive relative to the capital committed to the business. Comparing both can reveal whether strong headline profitability is supported by operating economics or influenced heavily by financing and accounting structure.
Frequently Asked Questions
Is ROIC always better than ROE?
No. The two metrics answer different questions. ROE is useful for understanding accounting profitability relative to shareholder equity. ROIC focuses more directly on operating returns relative to invested capital. The better metric depends on the question being asked, and both require careful definition.
Can share buybacks distort both ROE and ROIC?
They can affect the metrics differently. Buybacks can directly reduce shareholders’ equity and therefore raise ROE when net income is unchanged. ROIC may also change depending on whether the repurchase uses excess cash, new debt, or another funding source and on how invested capital is defined. It is not accurate to assume ROIC is completely unaffected by repurchases.
How far above WACC should ROIC be?
There is no universal minimum spread. A positive spread indicates that operating returns exceed the estimated cost of capital under the assumptions used, but WACC itself is an estimate. Investors should focus on the size, persistence, and reliability of the spread and whether new investments are expected to earn similar returns.
Investment Disclaimer
This article is for educational and research purposes only and is not a recommendation to buy or sell Microsoft or any other security. Financial figures are based on Microsoft’s public filings for the periods discussed and may change in future reporting periods. ROE, ROIC, free cash flow, and WACC may vary depending on the definitions and assumptions used. Investors are responsible for their own investment decisions and outcomes.