Free Cash Flow Conversion Ratio: What Apple’s FY2025 Gap Reveals

Apple's FY2025 net income increased while free cash flow declined, illustrating why the free cash flow conversion ratio requires careful analysis.

Apple reported substantially higher net income in fiscal 2025. Yet its free cash flow, calculated from the company’s cash flow statement, moved in the opposite direction. Net income increased 19.50% to $112.010 billion, while free cash flow fell 9.23% to $98.767 billion. Under a consistent free-cash-flow-to-net-income definition, Apple’s cash conversion ratio declined from 116.08% in … Read more

Semiconductor Gross Margin: What TSMC Reveals About Fab Economics

Semiconductor gross margin analysis showing a silicon wafer fab, production economics, and TSMC profitability drivers

A chipmaker can report faster revenue growth, higher gross profit, and a stronger gross margin while generating less free cash flow. Taiwan Semiconductor Manufacturing Company (NYSE: TSM) provided a useful example in the second quarter of 2026. TSMC’s revenue increased 12.0% sequentially, and its gross margin rose from 66.2% to 67.7%. Yet its quarterly free … Read more

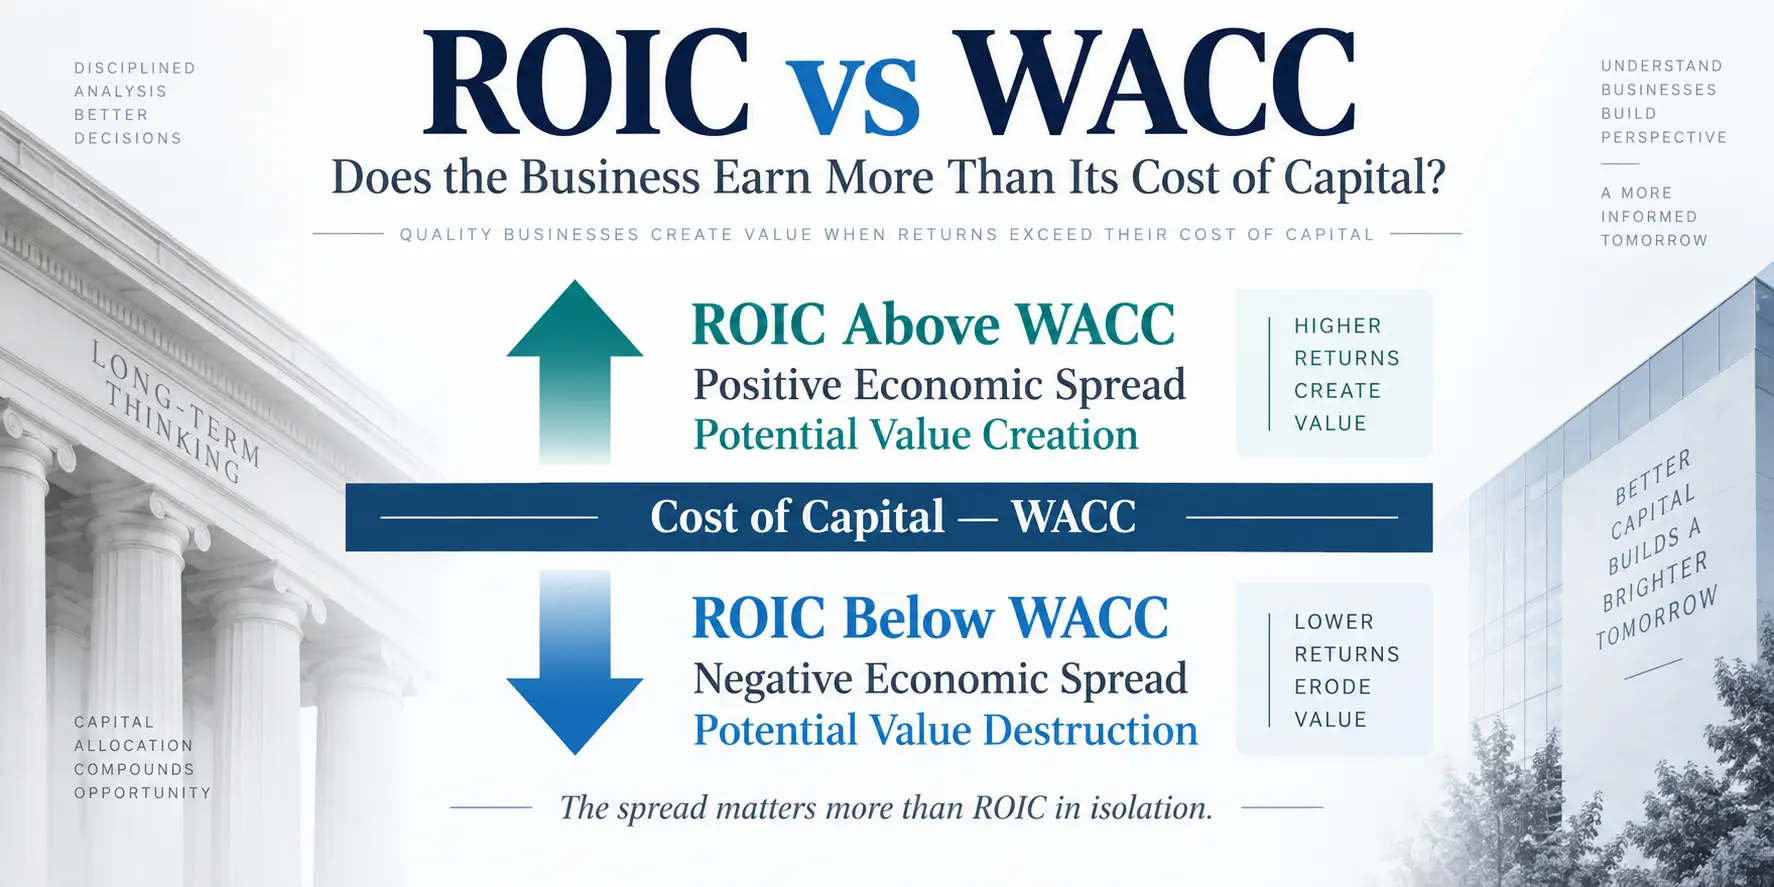
ROIC vs WACC: How to Measure Economic Profit and Capital Allocation

ROIC vs WACC comparison showing the spread between return on invested capital and cost of capital

ROIC vs WACC is one of the simplest ways to test whether a company is creating economic value with the capital it uses. ROIC measures the operating return generated on invested capital. WACC estimates the return demanded by the investors and lenders who supply that capital. The difference between the two is the economic spread. … Read more

Patent Cliff Risk: Essential Guide to Pharma Revenue Exposure

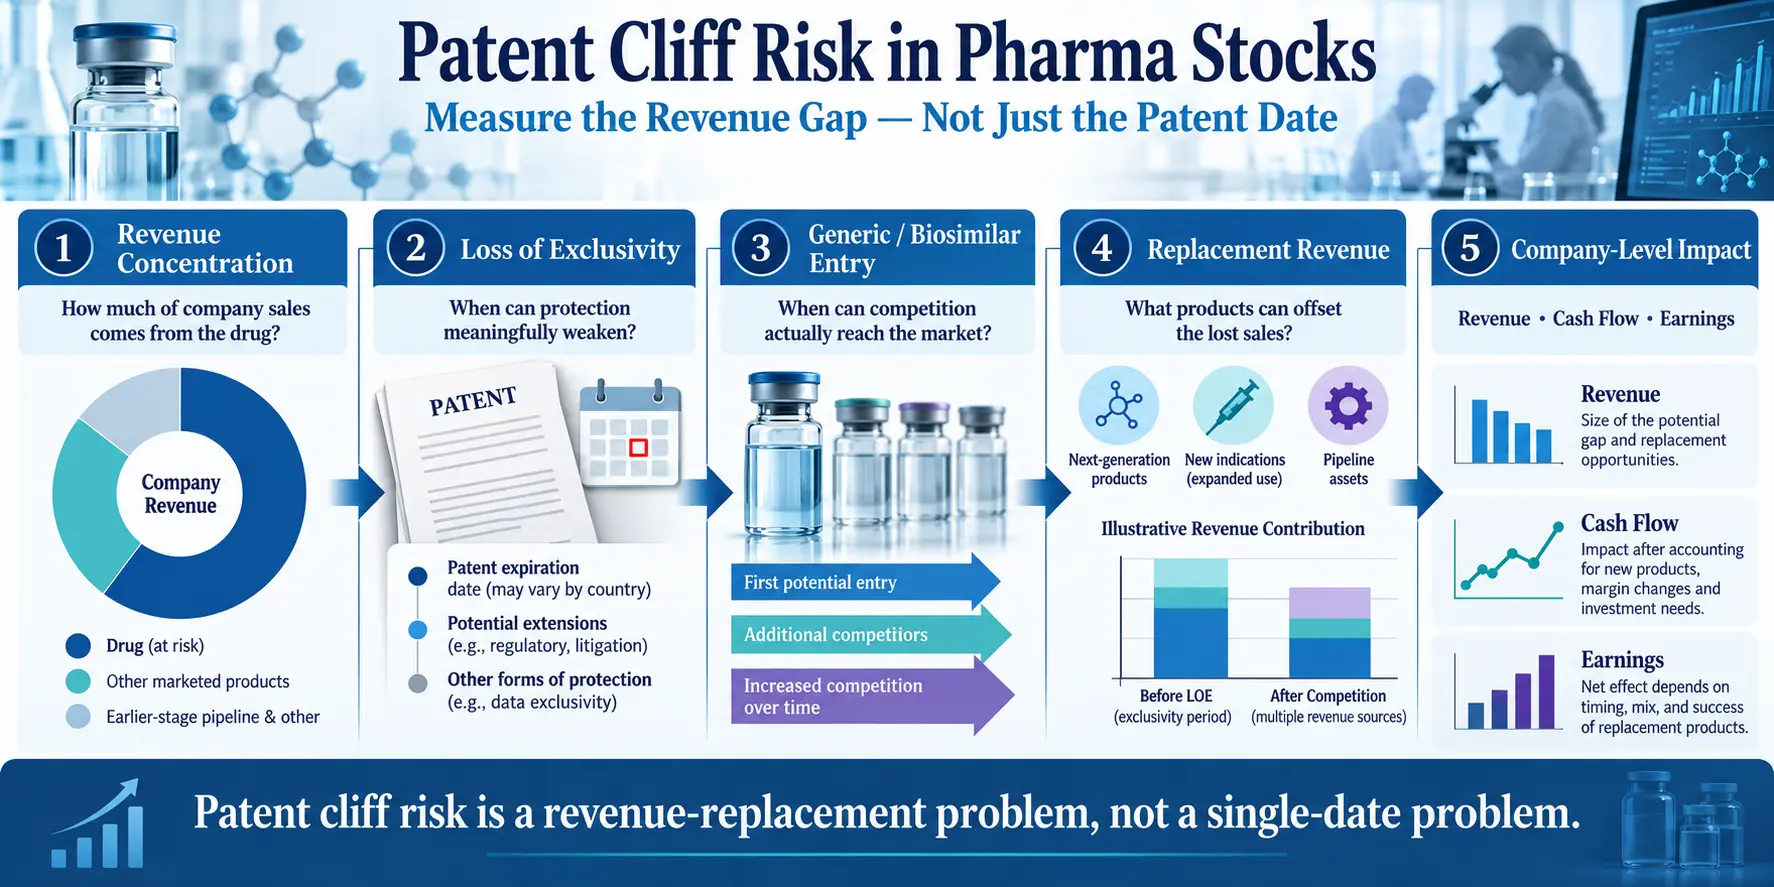
Patent cliff risk analysis for pharma stocks using revenue exposure, competition timing, and replacement sales

Patent cliff risk is best analyzed as a revenue-replacement problem, not as a single patent-expiration date. For a pharmaceutical investor, the useful questions are how much revenue is concentrated in the protected product, when meaningful generic or biosimilar competition can actually begin, how quickly that revenue may erode, and whether other products can fill the … Read more

Comparable Sales Explained: How to Read Retail Sales Growth

Comparable sales analysis for retail stocks using transactions and average ticket

Retail revenue growth can be deceptively simple. A company reports higher sales, investors see a positive percentage, and the initial conclusion is that the business is selling more. But for retailers such as Home Depot, Walmart, and Target, headline revenue growth does not tell you whether established stores are actually performing better. That is where … Read more

How CapEx Affects Free Cash Flow: Maintenance vs. Growth CapEx Explained

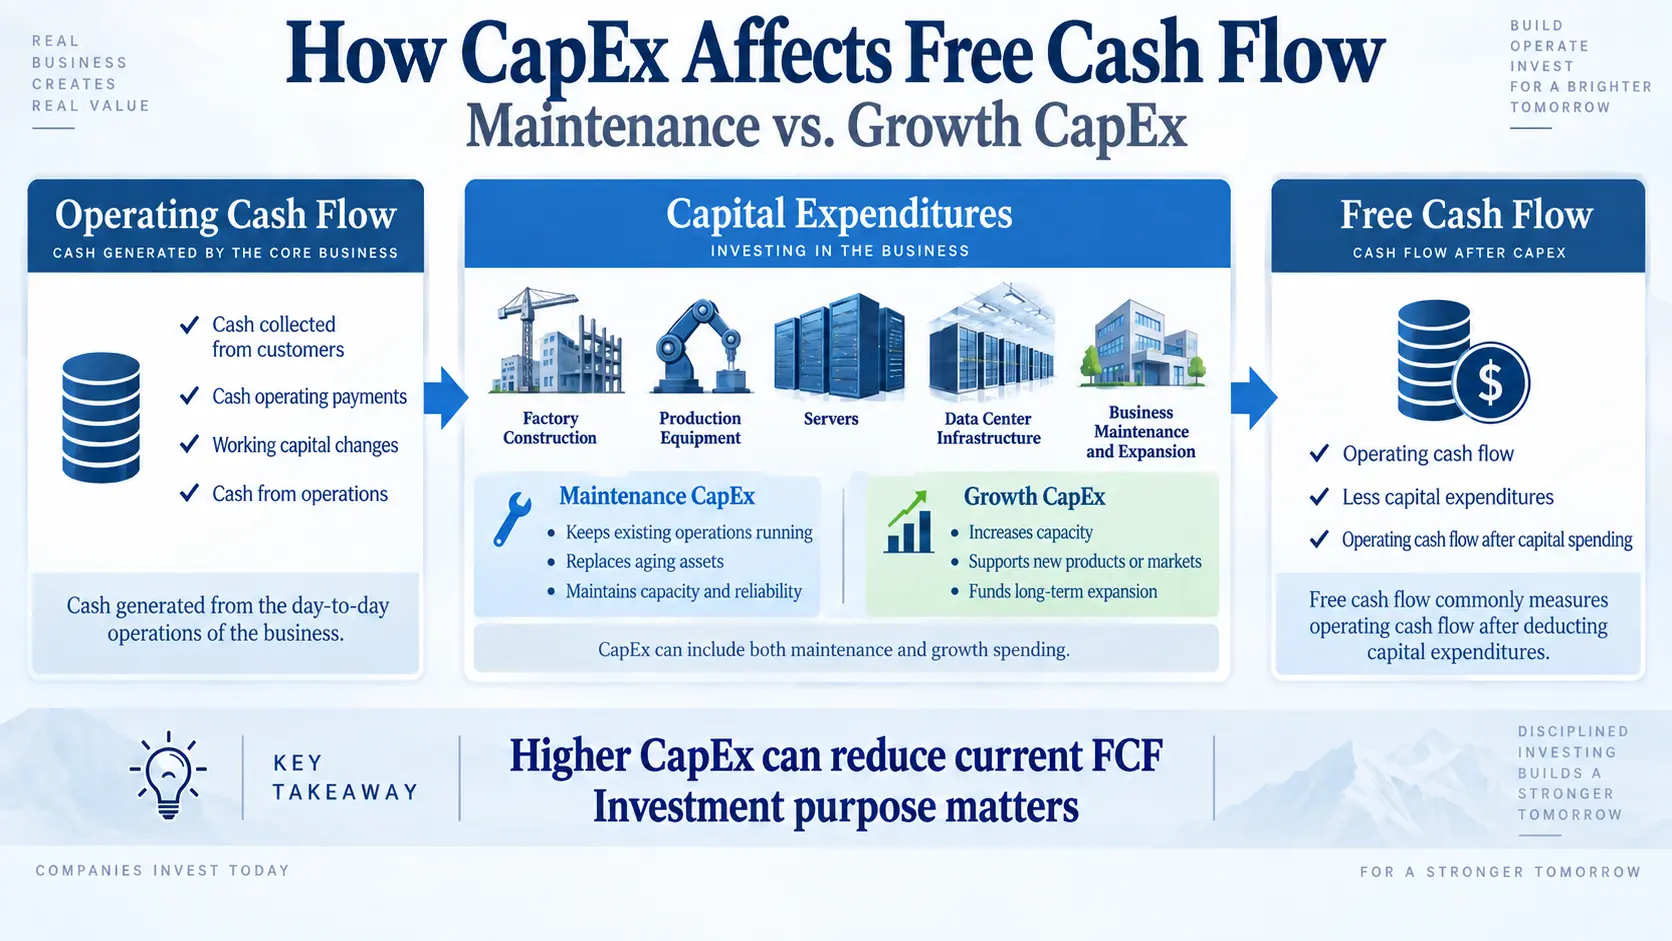
How CapEx affects free cash flow, including maintenance vs. growth CapEx

A company can report stronger revenue, higher operating profit, and more cash from operations while free cash flow still falls. One common reason is capital expenditures, or CapEx. That does not automatically mean the business is deteriorating. A company may be replacing aging equipment, building a new factory, expanding data-center capacity, or investing ahead of … Read more

Operating Leverage Explained: Why Profit Can Grow Faster Than Revenue

Operating leverage diagram showing how fixed costs can amplify changes in operating profit as revenue changes

Revenue growth and operating profit growth often move at very different speeds. A company might report a 10% increase in sales while operating profit rises 20%, 30%, or even more. One of the most useful concepts for understanding that gap is operating leverage. Operating leverage describes how a company’s cost structure can amplify the effect … Read more

How to Calculate Free Cash Flow Margin: A Practical Guide for Investors

Free cash flow margin example showing $100 of revenue and $15 of free cash flow for a 15% FCF margin

Revenue growth can make a business look stronger at first glance, but sales alone do not tell investors how much cash ultimately remains after the company funds its operations and capital spending. Free cash flow margin adds that missing perspective. It measures free cash flow as a percentage of revenue, giving investors a practical way … Read more

Net Debt Explained: A Practical Guide to a Company’s Real Debt Burden

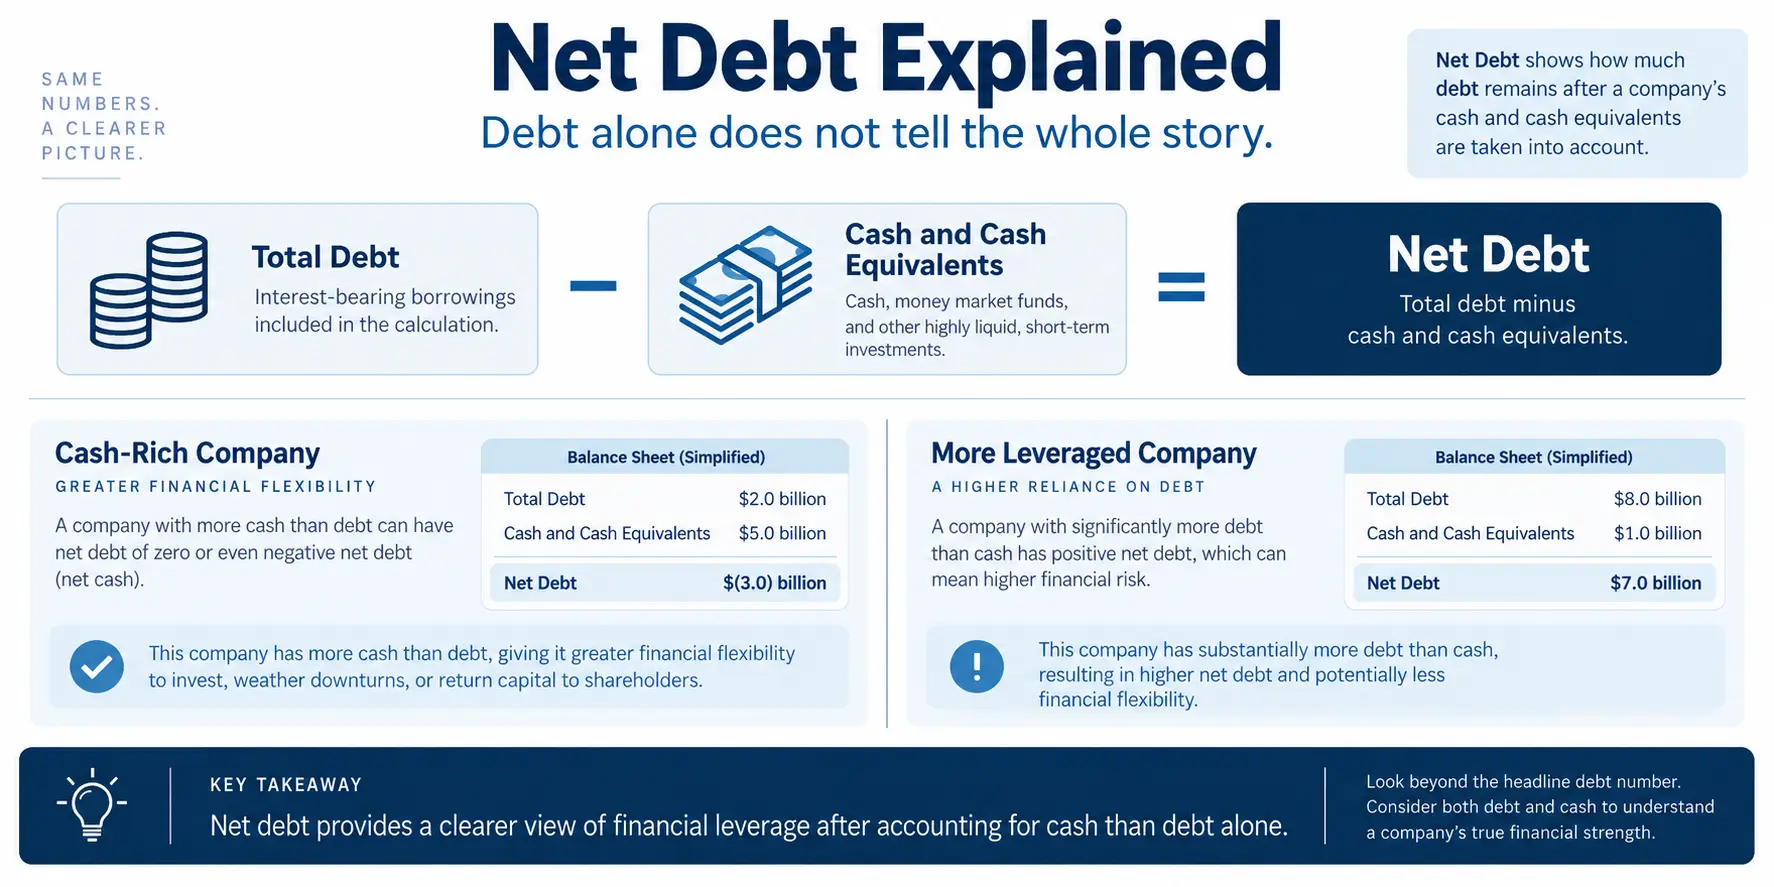
Net debt analysis comparing corporate debt, cash, and financial leverage

A company with a large amount of debt is not automatically in worse financial shape than a peer with less debt. The missing piece is often cash. A business may carry substantial borrowings while also holding enough cash and liquid assets to offset a meaningful portion of those obligations. That is why net debt is … Read more

How to Analyze Revenue Growth: Price vs. Volume vs. Mix

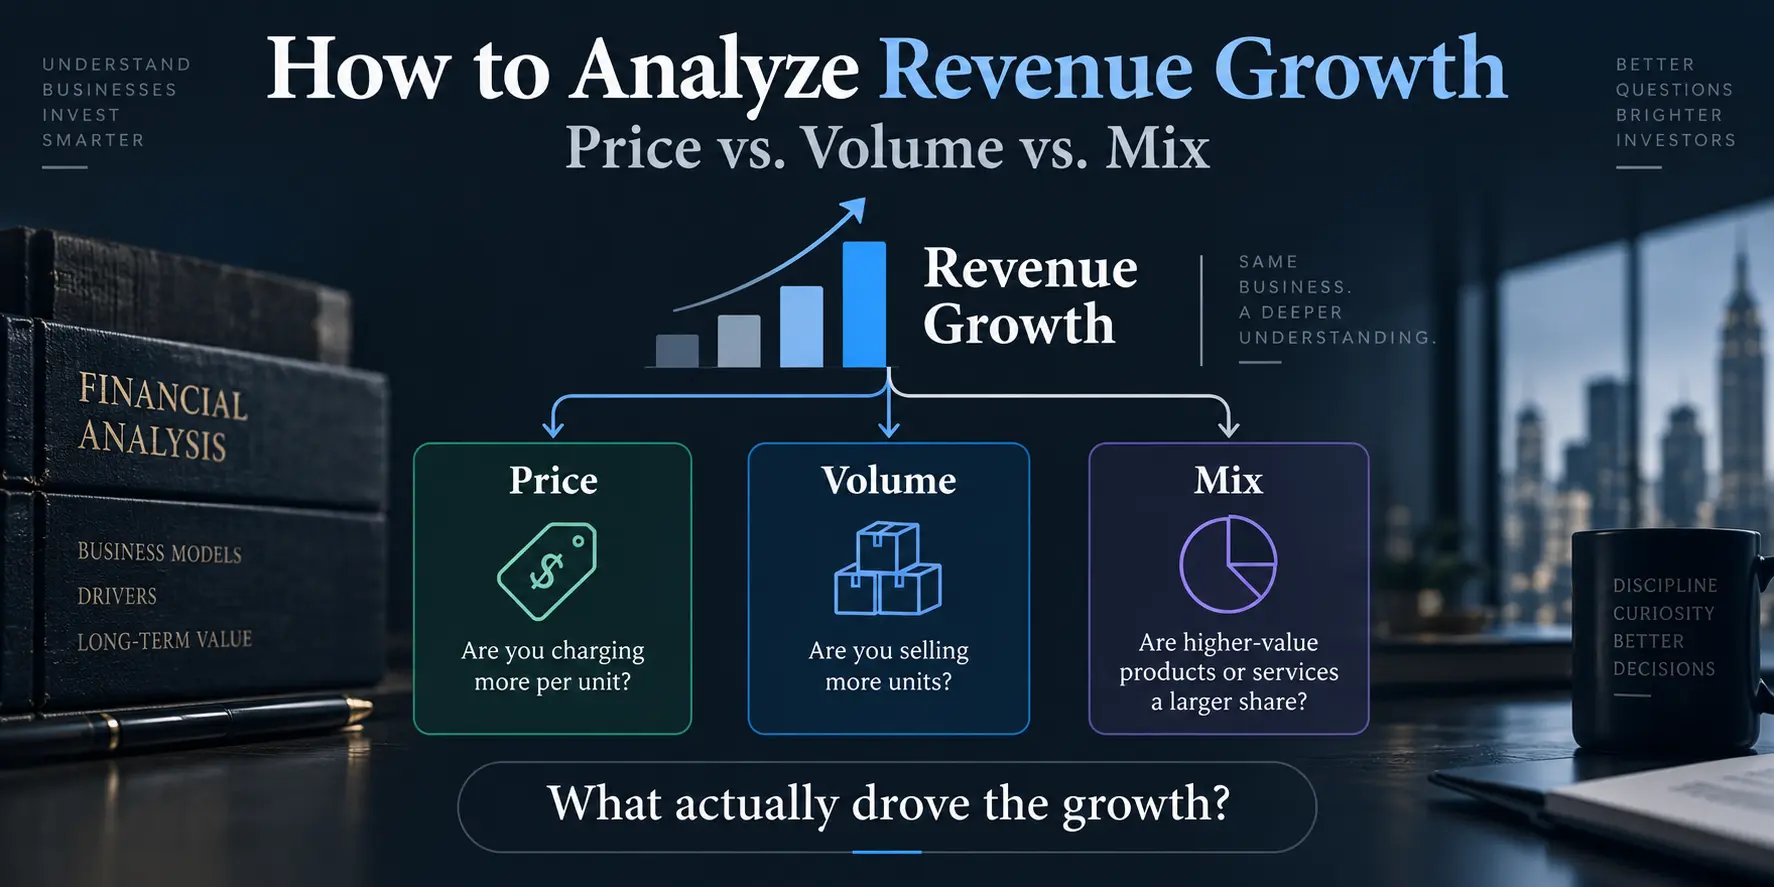
Revenue growth analysis separating price volume and product mix

How to analyze revenue growth is one of the most important questions in fundamental analysis because the headline growth rate rarely tells the whole story. A company can grow sales by raising prices, selling more units, shifting customers toward higher-priced products, benefiting from currency movements, or acquiring another business. That means investors should look beyond … Read more