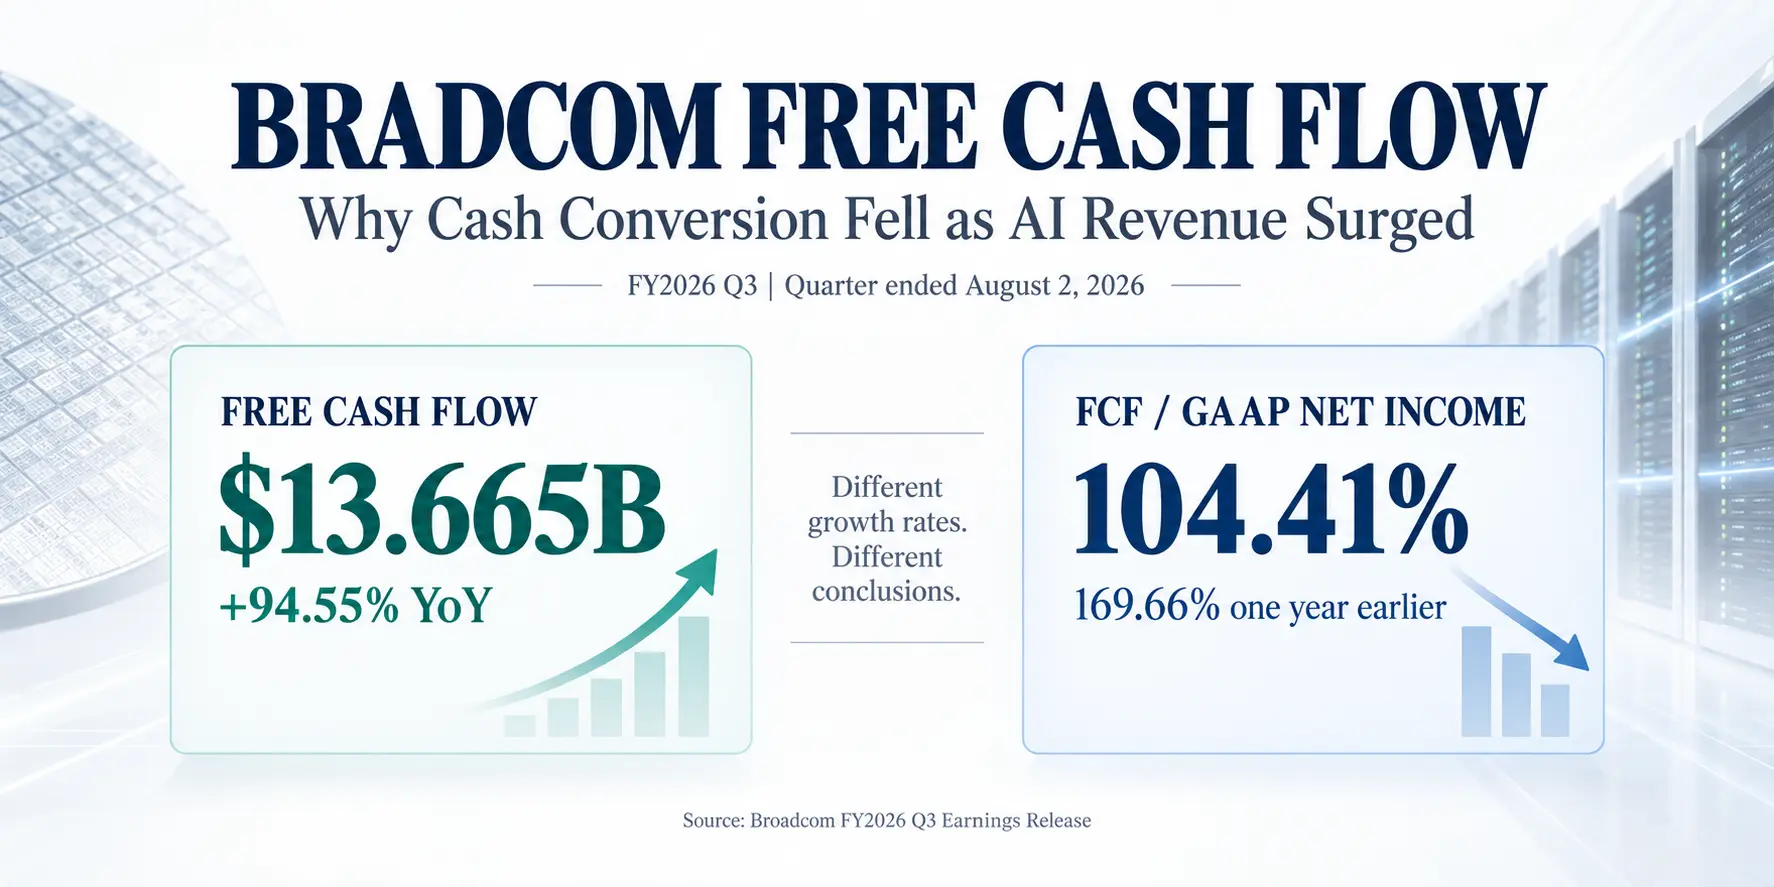
Broadcom free cash flow nearly doubled in fiscal Q3 2026. Yet one closely watched measure of cash conversion moved sharply in the opposite direction.
The company reported $13.665 billion in free cash flow (FCF), up approximately 94.55% from the year-earlier quarter. At the same time, FCF divided by GAAP net income declined from 169.66% to 104.41%.
That combination deserves a closer look. A falling cash conversion ratio may sound concerning, but the underlying financial statements show that Broadcom generated considerably more cash. The decline largely reflects a faster increase in the accounting earnings used as the denominator.
Research takeaway: Broadcom’s cash generation improved substantially in fiscal Q3 2026. Free cash flow reached $13.665 billion, and FCF margin increased to 46.18%. The GAAP earnings-based cash conversion ratio fell because GAAP net income grew much faster than FCF. Using Broadcom’s reported non-GAAP net income as an alternative denominator produces a markedly different comparison.
This analysis compares the fiscal quarters ended August 2, 2026 and August 3, 2025. It uses Broadcom’s September 2, 2026 earnings release and its fiscal Q3 2026 Form 10-Q. Dollar figures are reported in U.S. dollars, and calculated percentages are rounded.
Broadcom Free Cash Flow: Why Did Cash Conversion Fall?
The first step is defining the ratio. Cash conversion does not have one universally mandatory formula. This article initially uses free cash flow divided by GAAP net income:
FCF-to-GAAP-Net-Income Ratio = Free Cash Flow / GAAP Net Income × 100
For fiscal Q3 2025, Broadcom generated $7.024 billion in FCF and reported $4.140 billion in GAAP net income.
$7.024B / $4.140B × 100 = 169.66%
For fiscal Q3 2026, FCF increased to $13.665 billion, while GAAP net income reached $13.088 billion.
$13.665B / $13.088B × 100 = 104.41%
The calculated ratio declined by approximately 65.25 percentage points. But interpreting that change as a deterioration in cash generation would ignore an important difference in growth rates.
Broadcom’s GAAP net income grew approximately 216.14% year over year. FCF increased approximately 94.55%.
When the denominator grows much faster than the numerator, the ratio falls even if the numerator itself increases substantially.
Changing the Earnings Denominator Changes the Result
Broadcom also reports non-GAAP net income. Its reconciliation excludes specified items such as stock-based compensation, acquisition-related intangible amortization, restructuring costs, and certain tax adjustments.
For fiscal Q3 2025, non-GAAP net income was $8.404 billion. For fiscal Q3 2026, it was $16.372 billion.
Using those amounts as an alternative denominator produces the following calculations:
FY2025 Q3: $7.024B / $8.404B × 100 = 83.58%
FY2026 Q3: $13.665B / $16.372B × 100 = 83.47%
That is a decrease of only about 0.11 percentage point, compared with the 65.25-percentage-point decline produced by the GAAP-based calculation.
| Metric | FY2025 Q3 | FY2026 Q3 |
|---|---|---|
| Free cash flow | $7.024B | $13.665B |
| GAAP net income | $4.140B | $13.088B |
| Non-GAAP net income | $8.404B | $16.372B |
| FCF / GAAP net income | 169.66% | 104.41% |
| FCF / non-GAAP net income | 83.58% | 83.47% |
The comparison is a denominator-sensitivity test, not a claim that non-GAAP earnings provide a superior measure of cash conversion.
GAAP net income and non-GAAP net income are different accounting measures. Broadcom’s adjusted earnings exclude expenses that may still have economic consequences for shareholders. Stock-based compensation, for example, can create dilution even though it does not involve an equivalent immediate operating cash payment.
The non-GAAP-denominator ratio shown here is independently calculated. It should not be presented as an official Broadcom cash conversion metric or compared directly with companies using different adjustments.
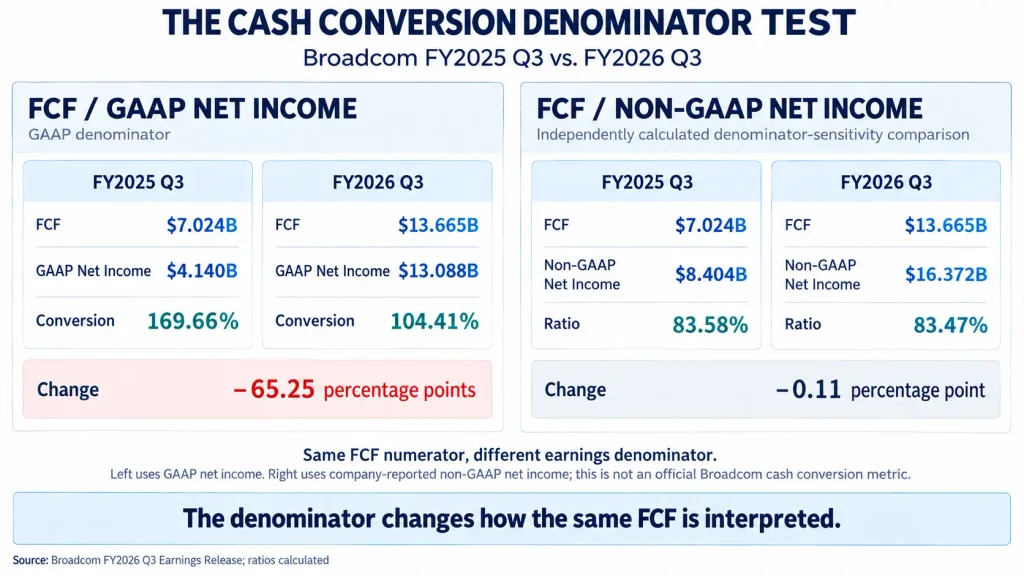
Broadcom’s calculated FCF-to-GAAP-net-income ratio declined by 65.25 percentage points, while the ratio using company-reported non-GAAP net income changed by only about 0.11 percentage point. The denominators are different and neither comparison should be treated as a universal earnings-quality score.
A related example appears in Smart Asset Desk’s Apple free cash flow conversion analysis. That article examines how changes in reported earnings, cash flow, and a major tax item can affect the interpretation of a conversion ratio.
Auditing the $13.665 Billion of Free Cash Flow
The earnings-denominator comparison explains the ratio, but it does not show where Broadcom’s cash came from.
For that, the cash flow statement provides a more direct answer.
Broadcom reported $14.197 billion in net cash provided by operating activities during fiscal Q3 2026. Cash purchases of property, plant, and equipment totaled $532 million.
The company’s reported free cash flow uses the following calculation:
FCF = Operating Cash Flow − Cash Capital Expenditures
$14.197B − $0.532B = $13.665B
This calculation reconciles to Broadcom’s reported FCF.
In the comparable quarter of fiscal 2025, operating cash flow was $7.166 billion and cash capital expenditures were $142 million, producing $7.024 billion of FCF.
Breaking down the year-over-year change helps distinguish increased cash generation from higher investment spending.
| Cash Flow Driver | YoY Change | Effect on FCF |
|---|---|---|
| Operating cash flow | +$7.031B | Positive |
| Cash capital expenditures | +$0.390B | Negative |
| Net change in FCF | +$6.641B | Approximately +94.55% |
The arithmetic is straightforward:
$7.031B − $0.390B = $6.641B of additional free cash flow
Capital spending increased, but the increase in operating cash flow was far larger.
That is materially different from a business reporting higher operating cash flow while spending even more on new infrastructure. The Smart Asset Desk guide to how CapEx affects free cash flow explains why investment requirements can change the relationship between earnings growth and cash remaining after reinvestment.
How Much of Operating Cash Flow Remained After Cash CapEx?
Another way to interpret Broadcom’s quarterly cash generation is to measure the percentage of operating cash flow remaining after the company’s defined capital expenditure deduction.
$13.665B / $14.197B × 100 = 96.25%
The $532 million in cash capital expenditures represented approximately 3.75% of quarterly operating cash flow.
This ratio is useful for understanding the reported FCF calculation. It should not be confused with the proportion of total economic costs that Broadcom avoided.
The company still incurs manufacturing-related costs, research and development expenses, working-capital commitments, interest obligations, and other expenses. Many of these are already reflected in operating cash flow rather than in the separate cash CapEx line.
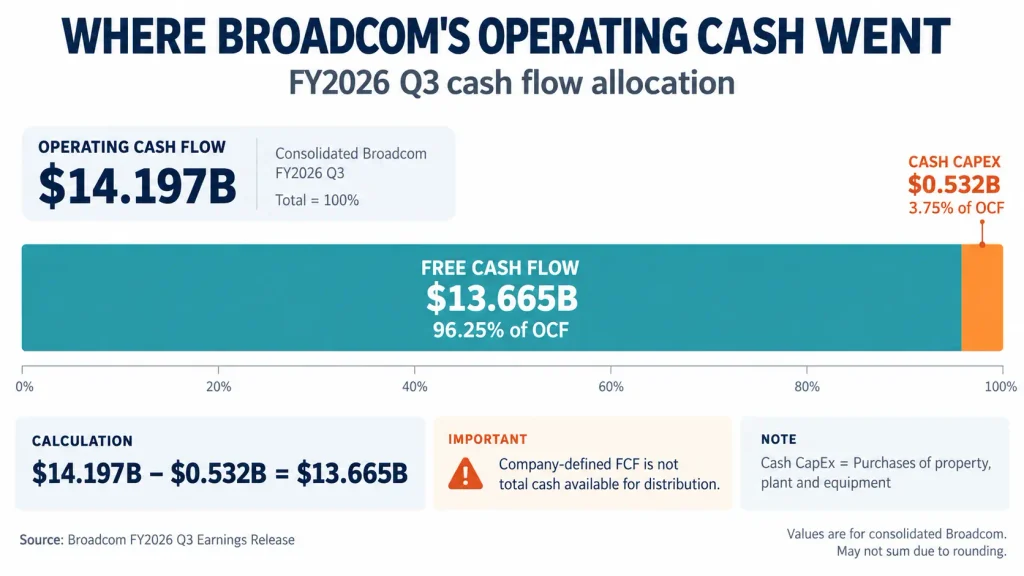
Broadcom reported $14.197 billion in operating cash flow and $532 million in cash purchases of property, plant, and equipment. Under its FCF definition, $13.665 billion remained, equal to approximately 96.25% of quarterly OCF. This percentage does not measure all economic investment requirements.
How Much of Broadcom’s Cash Flow Can Be Attributed to AI?
Broadcom’s AI semiconductor business was a major source of revenue growth in the quarter.
Management reported approximately $16.7 billion in AI semiconductor revenue, an increase of 221% from a year earlier and 54% from the preceding quarter. Demand for custom AI accelerators and networking products was identified as a major contributor.
Consolidated revenue reached $29.591 billion, an increase of approximately 85.50% year over year.
AI semiconductor revenue therefore represented approximately 56.4% of consolidated revenue.
There is an important distinction between that revenue share and cash-flow attribution.
Broadcom reported $20.839 billion in total semiconductor solutions revenue and $8.752 billion from infrastructure software during fiscal Q3 2026. Both segments contributed to the company’s consolidated results.
The $13.665 billion FCF figure includes the cash-flow effects of the entire consolidated business. It is not a separately disclosed figure for AI accelerators, AI networking, or the semiconductor segment alone.
Consequently, dividing total corporate FCF by AI semiconductor revenue would not produce a valid standalone AI business FCF margin.
Operating Profit Grew Faster Than Revenue
Broadcom’s GAAP operating income increased from $5.887 billion to $15.955 billion, approximately 171% year over year.
That exceeded consolidated revenue growth of approximately 85.50%.
The corresponding GAAP operating margin increased from approximately 36.90% to 53.92%.
On a non-GAAP basis, operating income increased from $10.455 billion to $20.095 billion, approximately 92%.
The difference between GAAP and non-GAAP growth is meaningful. Broadcom’s adjustments include stock-based compensation, acquisition-related intangible amortization, and other specified items. Analysts should therefore identify the earnings definition before using an operating-margin comparison to support a valuation thesis.
The simultaneous growth in AI revenue, consolidated operating income, and FCF is consistent with a company expanding both sales and cash generation. It does not establish a precise dollar contribution from AI to operating cash flow.
Three Cash Flow Details That Can Change the Interpretation
Even when reported FCF is strong, the underlying cash flow statement may reveal factors that deserve monitoring.
1. Accounts Receivable and Inventory Can Consume Cash
Broadcom’s fiscal Q3 2026 cash flow statement reported a $2.859 billion cash-flow reduction from changes in trade accounts receivable, net, and a $195 million reduction associated with inventory changes.
Accounts payable changes, by comparison, contributed a positive $1.630 billion to operating cash flow.
These items do not independently establish whether customer collections are healthy or unhealthy. They show how operating assets and liabilities affected the quarter’s reported cash generation.
The balance sheet provides additional context. Trade accounts receivable increased from $7.145 billion at November 2, 2025 to $13.707 billion at August 2, 2026. Inventory increased from $2.270 billion to $4.523 billion over the same balance-sheet dates.
Broadcom attributed the increase in receivables primarily to higher semiconductor revenue and collection timing. Inventory expansion also reflected preparation for anticipated semiconductor demand.
Those explanations make business sense during a rapid growth period. They still warrant follow-up: anticipated demand must eventually become shipments, customer payments, and cash.
2. Receivables Factoring Affects Collection Timing
Broadcom’s Form 10-Q also discloses non-recourse factoring arrangements under which certain trade receivables are sold to financial institutions.
The company records qualifying proceeds as operating cash inflows.
Receivables sold under these arrangements totaled $1.600 billion during fiscal Q3 2026, compared with $1.700 billion in the year-earlier quarter.
For the first three fiscal quarters combined, the corresponding amounts were $3.950 billion in fiscal 2026 and $5.651 billion in fiscal 2025.
This matters because factoring can affect the timing of reported operating cash collections. The disclosed amounts are not additional profit, and they should not simply be subtracted from reported FCF to manufacture an unofficial adjusted measure.
The quarter-to-quarter comparison also does not support attributing the entire increase in operating cash flow to factoring. Reported receivables sold through the arrangements were actually lower year over year in fiscal Q3 2026.
Investors reviewing the sustainability of FCF should watch both accounts receivable balances and the company’s future use of these arrangements.
3. Stock-Based Compensation Remains an Economic Consideration
Broadcom reported $2.019 billion in stock-based compensation for fiscal Q3 2026.
Under the indirect operating cash flow method, stock-based compensation is added back to net income because it generally does not represent an equivalent immediate cash payment during the period.
That accounting treatment is appropriate, but it does not make stock-based compensation economically irrelevant.
Equity awards can dilute existing ownership, while repurchases intended to offset dilution may require substantial cash.
This distinction becomes particularly relevant when a technology company’s free cash flow appears unusually large relative to reported GAAP net income.
Rather than relabeling an arbitrary stock-compensation-adjusted amount as official FCF, investors can examine the company’s disclosed FCF alongside stock issuance, diluted shares, repurchases, and compensation trends.
Is Broadcom’s Free Cash Flow Improvement Visible Beyond One Quarter?
Quarterly cash flows can be influenced by collection timing, supplier payments, and capital expenditure schedules.
One way to reduce dependence on a single reporting period is to compare the first three fiscal quarters of 2026 with the corresponding period of 2025.
| First Three Fiscal Quarters | FY2025 | FY2026 |
|---|---|---|
| Revenue | $45.872B | $71.089B |
| GAAP net income | $14.608B | $29.747B |
| Operating cash flow | $19.834B | $32.950B |
| Cash CapEx | $0.386B | $1.013B |
| Free cash flow | $19.448B | $31.937B |
| FCF margin | 42.40% | 44.93% |
| FCF / GAAP net income | 133.13% | 107.36% |
Broadcom’s nine-month FCF increased approximately 64.22%, from $19.448 billion to $31.937 billion.
FCF margin also improved from 42.40% to 44.93%, while the GAAP net-income-based conversion ratio declined from 133.13% to 107.36%.
The broader comparison supports two observations. Broadcom generated more free cash flow in absolute terms and retained more FCF relative to revenue. At the same time, GAAP accounting earnings grew faster than the cash-flow measure.
The trend is not confined to one quarter, although nine months of results should not be confused with a completed fiscal year or a long-term forecast.
What Does a 46.18% FCF Margin Actually Mean?
Broadcom’s fiscal Q3 2026 FCF margin is calculated by dividing the company’s reported free cash flow by consolidated revenue:
$13.665B / $29.591B × 100 = 46.18%
The comparable fiscal Q3 2025 calculation was:
$7.024B / $15.952B × 100 = 44.03%
This represents an increase of approximately 2.15 percentage points.
Put differently, Broadcom generated approximately $46.18 of FCF for each $100 of reported revenue during the latest analyzed quarter, under the company’s stated FCF definition.
FCF margin and earnings-based conversion are not interchangeable. One uses revenue as the denominator, while the other uses a specified earnings measure.
For the broader methodology, see How to Calculate Free Cash Flow Margin. The distinction becomes particularly important when comparing companies with different accounting adjustments and capital requirements.
What This Means for AVGO Investors: Follow the Cash, Then Capital Allocation
A high FCF number can help a company support dividends, repurchases, debt reduction, or future investment. It does not mean every dollar is immediately available for discretionary distribution without consequences.
During the first three fiscal quarters of 2026, Broadcom reported $9.281 billion in cash dividend payments and $8.450 billion in repurchases under its share-repurchase program.
Those uses of cash should be evaluated alongside the $31.937 billion of nine-month FCF, the company’s debt obligations, and its ongoing operating requirements.
Broadcom’s business model also complicates comparisons with hyperscale cloud providers.
Its semiconductor activities use external manufacturing partners, while cloud operators may own or finance substantial data-center buildings, servers, networking equipment, and other infrastructure.
As a result, a lower cash CapEx-to-revenue ratio at Broadcom does not prove that supplying AI chips requires little economic investment throughout the supply chain.
It indicates that the company’s own reported cash capital expenditures are relatively modest compared with its consolidated revenue and operating cash generation.
Investors comparing semiconductor suppliers with cloud infrastructure operators should assess each company’s cash flow definition and business model before treating differences in FCF margins as differences in investment quality.
What to Watch in Broadcom’s Next Earnings Release
In its September 2, 2026 earnings release, Broadcom projected approximately $34.8 billion in fiscal Q4 2026 consolidated revenue and about $21.7 billion in AI semiconductor revenue.
Those amounts were management guidance, not completed fourth-quarter results.
When the next report becomes available, several related questions will help test whether the cash-flow pattern continues.
- Does AI revenue growth continue to support consolidated operating profit? Higher AI sales are encouraging, but operating profitability should be reviewed using consistent GAAP or non-GAAP definitions.
- Do receivables and inventory normalize relative to growth? Rapid expansion can increase working-capital requirements, so customer collections and shipment timing deserve attention.
- Does operating cash flow continue growing faster than cash CapEx? That relationship was favorable in fiscal Q3 2026, but investment and cash collection patterns can change.
- How do GAAP and adjusted earnings compare with FCF? A conversion ratio becomes more informative when the denominator and its adjustments are clearly identified.
- How is cash allocated after FCF is generated? Dividends, repurchases, debt repayments, and other financing needs affect financial flexibility beyond the basic FCF calculation.
The useful question is not whether every percentage remains at a particular level. It is whether Broadcom continues to produce growing, repeatable operating cash flow while funding the needs of its businesses.
Two Common Mistakes When Reading AVGO Cash Flow
Does FCF Conversion Above 100% Mean Broadcom Stock Is Undervalued?
No. A ratio above 100% under the FCF-to-GAAP-net-income formula means FCF exceeded GAAP net income during that period.
It does not determine whether the stock price is attractive. Valuation requires additional information about future earnings, cash flow, growth, risk, and the price investors are paying.
It also does not guarantee superior earnings quality. Non-cash expenses and working-capital timing can influence the result.
Can Broadcom’s FCF Margin Be Compared Directly With a Hyperscaler’s?
The arithmetic can be compared if definitions and periods are consistent, but the economic conclusions require care.
A company that operates substantial physical data-center infrastructure may have a very different capital expenditure profile from a semiconductor designer that relies on external manufacturing partners.
FCF margin is useful for measuring cash generated relative to revenue. It does not replace an analysis of invested capital, the supply chain, or the eventual return earned on investment.
The Investment Interpretation
Broadcom’s fiscal Q3 2026 results offer a useful example of why investors should examine cash generation and accounting earnings separately.
FCF increased from $7.024 billion to $13.665 billion. Operating cash flow rose substantially, and the additional cash spent on capital expenditures was relatively small compared with the increase in cash from operations.
The reported FCF margin improved to 46.18%.
Yet the FCF-to-GAAP-net-income ratio fell to 104.41% because the GAAP earnings denominator grew much faster. Repeating the calculation with company-reported non-GAAP net income produces a ratio of approximately 83.47%, little changed from 83.58% a year earlier.
Neither denominator tells the whole story. The cash flow statement, the earnings reconciliation, working-capital disclosures, factoring activity, stock-based compensation, and capital expenditure requirements each answer a different question.
For AVGO investors, the financial evidence supports a strong period of consolidated cash generation alongside rapid AI semiconductor growth. How much of that performance can persist will depend on customer demand, collections, profitability, reinvestment requirements, and capital allocation.
The strongest future evidence will come from several more periods of cash-flow statements, not from a single conversion percentage.
Data and methodology: This article uses Broadcom fiscal Q3 2026 and fiscal Q3 2025 results, together with the corresponding first-three-quarter fiscal-year periods, as reported in the company’s September 2, 2026 earnings release and fiscal Q3 Form 10-Q. Free cash flow follows the company’s operating-cash-flow-minus-cash-PP&E definition. FCF margins and earnings-based conversion ratios are independently calculated and rounded to two decimal places. Non-GAAP net income is company-defined and is used only for the stated alternative-denominator comparison.
Investment Disclaimer: This article is for educational and investment research purposes only. It is not a recommendation to buy, sell, or hold any security. Financial results and guidance may change after the reporting date. Investors are responsible for their own investment decisions and associated risks.