
During periods of prolonged macroeconomic tightening and equity market volatility, conservative income allocators face a recurring dilemma: discerning whether high nominal distributions signal compelling valuation floors or foreshadow structural dividend reductions. When defensive telecom bellwethers drift into historically high yield territories, speculative emotion must yield to rigorous empirical auditing. Establishing institutional clarity requires assessing Verizon VZ dividend safety through underlying cash-flow mechanics, capital expenditure discipline, and rules-based accumulation bands.
“Accounting net income frequently misleads telecom equity allocators due to massive, non-cash network depreciation schedules. Genuine dividend sustainability hinges entirely on post-CapEx free cash flow and the structural margin of safety guarding distribution obligations.”
1. Verizon VZ Dividend Safety & Core Financial Metrics Breakdown
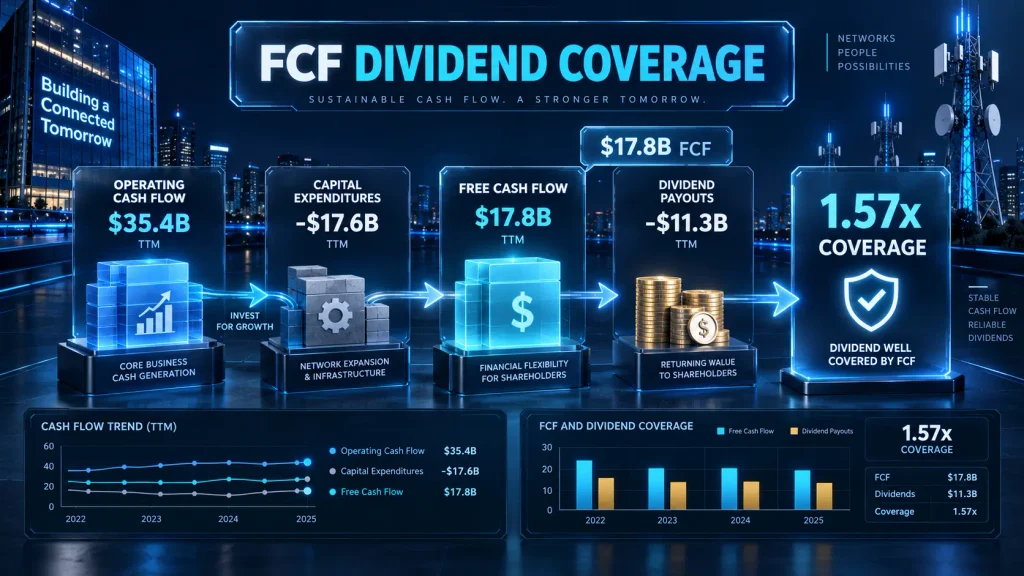
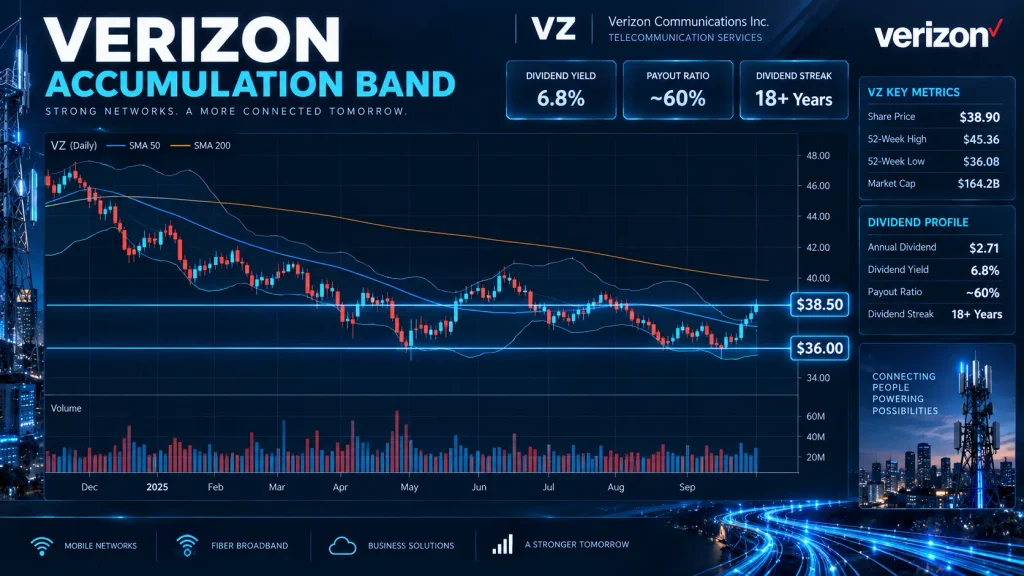
Verizon Communications Inc. (NYSE: VZ) maintains an exceptionally resilient distribution profile supported by $17.8 billion in trailing free cash flow against $11.3 billion in annual cash distributions. Operating with a 1.57x FCF coverage multiple, approximately 60% payout ratio, and eighteen consecutive years of distribution increases, the equity pairs an annualized 6.8% yield at $38.90 with firm technical support shelves at $38.50 and $36.00.
| Metric Category | Observed Parameter | Fundamental & Quantitative Role | Institutional Allocation Action |
|---|---|---|---|
| Current Dividend Yield | 6.8% (at $38.90 close) | $2.71 annualized DPS; top-decile historical yield band | Reinvest distributions via DRIP for compound cash-flow growth |
| FCF Dividend Coverage | 1.57x (~60% FCF Payout Ratio) | $17.8B FCF comfortably absorbs $11.3B dividend outlay | Distribution cut risk remains negligible across macro cycles |
| Primary Support Shelf | $38.50 Level | Multi-pivot price floor and rolling volatility boundary | Deploy initial tranche (30%) upon confirmed daily bottoming |
| Secondary Defensive Shelf | $36.00 to $36.50 Zone | Multi-year cyclical structural base offering 7.5%+ yield | Reserve dry powder for macro liquidity widening events |
2. Balance Sheet Quality, Cash Flow Durability, and Capital Allocation
Operating nationwide telecommunications infrastructure represents an oligopolistic enterprise model with virtually insurmountable barriers to entry. Verizon operates in a three-player national mobile footprint where wireless connectivity functions as an indispensable non-discretionary utility, generating highly inelastic, recurring cash inflows from broad consumer and enterprise subscriber bases.
Auditing official filings housed within the SEC EDGAR Corporate Database confirms the stability of these cash dynamics. Over the trailing twelve months, the operator generated $35.4 billion in robust operating cash flow. Following the peak capital-intensity phase of its nationwide C-Band 5G rollout, annual capital expenditures moderated to $17.6 billion, yielding a normalized free cash flow cushion of $17.8 billion.
Against this $17.8 billion FCF baseline, total cash dividend distributions require approximately $11.3 billion. This leaves roughly $6.5 billion in residual organic cash flow, allowing management to comfortably balance ongoing debt amortizations without compromising eighteen consecutive years of nominal dividend increases. The underlying cash buffer confirms that solvency risks remain orderly and well-contained.
3. Valuation Band Modeling: Historical Multiples and Margin of Safety
Trading at $38.90, the equity is priced within its historical 52-week range ($36.08 to $45.36) with an institutional market capitalization of roughly $164.2 billion. Supported by an established annual payout of $2.71 per share, the prevailing 6.8% dividend yield and manageable 60% payout ratio offer defensive characteristics rarely matched across benchmark fixed income or consumer defensive alternatives.
From a chart-based allocation perspective, daily price action continues to establish a base below its descending moving averages. Derived through historical multiple boundaries, the institutional accumulation channel between $36.00 and $38.50 offers a quantified margin of safety. The primary floor at $38.50 coincides with multi-touch horizontal support, providing an optimal initial point for disciplined staging.
Should systemic liquidity pressures breach the primary floor, the multi-year horizontal shelf between $36.00 and $36.50 serves as an ultimate institutional accumulation boundary. Near $36.00, the annualized yield approaches 7.5%, historically triggering decisive demand from total-return income funds and pension allocators.
4. Portfolio Integration: Rules-Based Execution and Risk Management
A common pitfall among retail income participants is executing concentrated lump-sum purchases based purely on elevated dividend yields. When cyclical headwinds induce prolonged multiple compression, equities can trade along lower volatility envelopes for extended horizons. Fiduciary capital deployment requires strict position sizing and predefined staging schedules.
Our operational framework emphasizes a 3-tier accumulation protocol: allocate an initial 30% tranche upon confirming daily stabilization candles at the $38.50 primary shelf. Deploy a secondary 40% allocation only after price action reclaims structural moving averages, while reserving the remaining 30% in short-duration liquidity to exploit potential oversold tests near the $36.00 structural boundary.
Within balanced tax-deferred accounts such as a Roth IRA or 401(k), individual telecom exposure should remain capped within 5% to 8% of total portfolio equity assets. Directing steady quarterly cash flows into high-growth compounders or cash-equivalents builds an institutional-grade compounding engine immune to single-stock volatility.
Related Portfolio Allocation & Balance Sheet Research
Examine complementary equity valuation models, technical moving average frameworks, and dividend sustainability guides across our institutional research database:
-
[Mega-Cap Semiconductor Analysis] Broadcom (AVGO) 200-Day Moving Average Support and RSI Rebound
Analyze institutional trendlines and oversold momentum reversals across high-cash-flow technology leaders.
-
[Defensive Dividend Royalties] McDonald’s Valuation Multiples and 3-Tier Staged Entry Model
Managing defensive consumer franchise positions through systematic valuation bands and payout ratio checks.
-
[Capital Efficiency Guide] Evaluating Corporate Economic Moats Through ROIC and Free Cash Flow
A structured framework for measuring enterprise reinvestment rates, capital preservation, and competitive advantage duration.
5. Frequently Asked Questions (FAQ)
What poses the most critical risk to Verizon VZ dividend safety over the next cycle?
The primary risk stems from managing elevated net debt amid higher refinancing rates. However, with annual capital expenditure stabilizing near $17.6 billion and organic free cash flow generating $17.8 billion, post-dividend excess liquidity of $6.5 billion ensures management maintains substantial debt-reduction runway without threatening payout continuity.
Why is free cash flow dividend payout more reliable than accounting earnings payout ratios?
Capital-intensive telecom companies incur massive, non-cash depreciation and amortization expenses that artificially suppress accounting GAAP net income. Because dividends are paid strictly in cash, the FCF dividend payout ratio (currently ~60%) offers an undistorted reflection of corporate cash generation and distribution coverage.
How should income allocators structure order entry between the $38.50 and $36.00 levels?
Fiduciary discipline suggests initiating a 30% position at the $38.50 primary shelf once daily reversal candles appear, adding 40% upon moving average reclamation. The final 30% should be preserved in short-term liquid reserves to capitalize on structural oversold dislocations near $36.00 should broad credit spreads widen.
Regulatory & Investment Disclaimer
This research report is strictly for informational and educational purposes based on publicly available data. It does not constitute individualized investment advice, financial planning, or a solicitation to buy or sell securities. Past performance is no guarantee of future returns. Readers must conduct their own due diligence or consult a licensed fiduciary advisor.