
During periods of heightened macro volatility, defensive equity investors frequently misstep by panic-selling during sector-wide multiple compressions or attempting to catch falling knives without quantitative risk buffers. As capital-intensive telecom operators navigate debt-refinancing dynamics, the daily interaction between price action and the Verizon Bollinger Bands lower channel provides institutional allocators with an objective, rules-based gauge for assessing seller exhaustion, underlying cash-flow durability, and disciplined dollar-cost averaging tranches.
“A lower Bollinger Band test does not trigger an automatic buy signal; rather, it provides an institutional volatility alert that pricing has reached a statistical two-sigma divergence. True accumulation requires daily confirmation candles and sustained balance-sheet safety margins.”
1. Verizon Bollinger Bands & Core Financial Metrics Breakdown
For Verizon Communications Inc. (NYSE: VZ), a daily lower Bollinger Band test confirms that market quotation has drifted beyond the 95.4% normal distribution boundary of its rolling twenty-day window. Rather than executing speculative lump-sum orders, fiduciary allocators cross-reference bandwidth expansion against underlying free cash flow generation to deploy capital methodically.
| Metric Category | Observed Parameter | Technical & Fundamental Role | Institutional Allocation Action |
|---|---|---|---|
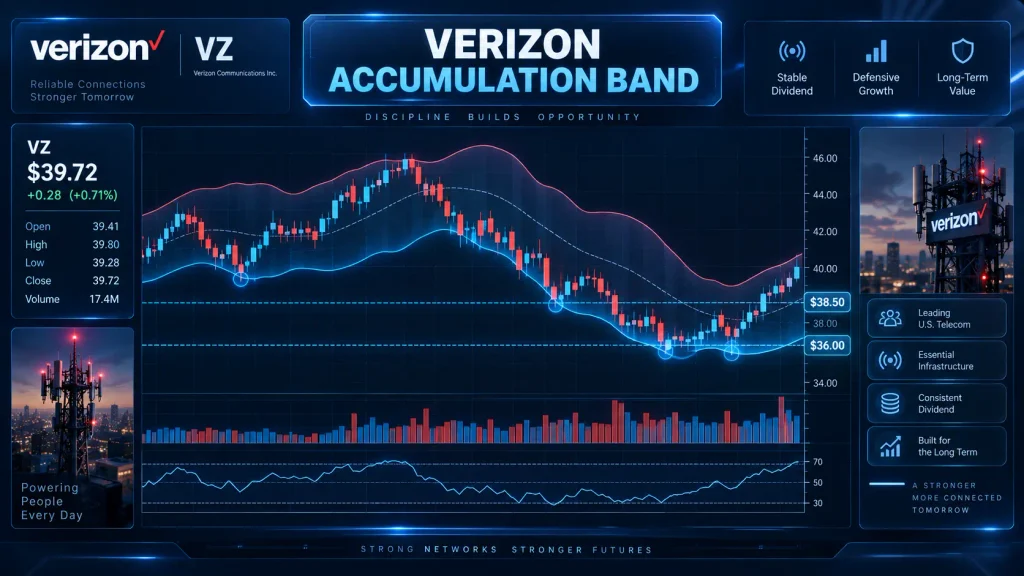
| Lower Bollinger Band | $38.50 Level (-2.0σ) | Statistical oversold boundary threshold | Initial watchlist alert; stage 1st tranche (30%) on daily close |
| Central Baseline (20 SMA) | $40.80 Baseline | Mean-reversion midpoint and primary supply shelf | Deploy 2nd tranche (40%) upon breakout and daily retest |
| Structural Valuation Floor | $36.00 – $36.50 Zone | Historical multi-year horizontal support & 6.5%+ yield floor | Contingency reserve zone if band riding persists |
| Bandwidth Metric | Downward Expansion Mode | Measures directional volatility expansion | Enforce patient order staging while volatility accelerates |
2. Balance Sheet Quality, Cash Flow Durability, and Capital Allocation
Technical indicators possess enduring analytical value only when anchored to verified balance-sheet resilience. As documented throughout official regulatory disclosures compiled within the SEC EDGAR Corporate Database, the firm operates as a capital-intensive utility proxy whose wireless broadband subscriber base yields predictable, subscription-like operating cash receipts.
Furthermore, evaluating the durability of the distribution profile requires scrutinizing free cash flow generation rather than standard GAAP net income. Because heavy network depreciation charges artificially compress accounting earnings, the actual cash dividend payout ratio hovers conservatively below 65% of trailing free cash flow, ensuring management preserves sufficient liquidity to service long-term maturities without jeopardizing continuous dividend distributions.
3. Valuation Band Modeling: Historical Multiples and Margin of Safety
Applying classical channel modeling to daily price activity demonstrates that the recent pullback from $43.00 has driven quotation into direct proximity with the primary lower envelope near $38.50. At this juncture, the equity trades at roughly 8.9 times forward earnings while offering an annualized dividend yield above 6.3%, historically signaling deep valuation compression.
Consequently, established capital preservation models define the institutional accumulation channel between $36.00 and $38.50 as a robust fundamental margin of safety. While the initial floor near $38.50 represents an attractive statistical divergence, conservative participants must designate the multi-year horizontal shelf between $36.00 and $36.50 as an indispensable secondary defense line, providing insulation against cyclical credit widening.
4. Portfolio Integration: Rules-Based Execution and Risk Management
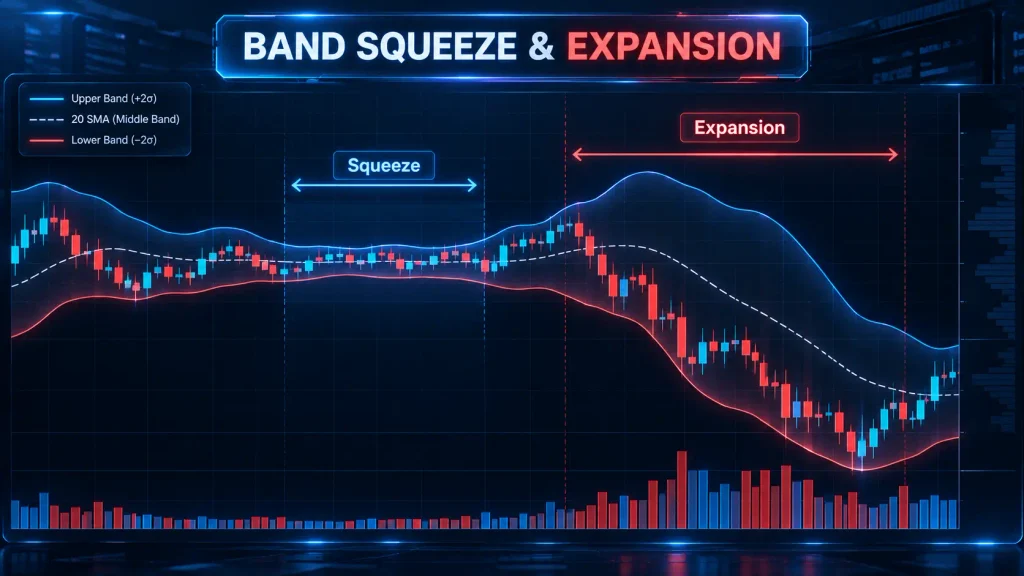
The primary risk confronting mechanical technical allocators is the phenomenon known as band riding. During aggressive downtrends driven by institutional liquidations, price candles continually push the lower envelope downward while bandwidth widens aggressively. Under these conditions, an oversold tag functions not as an exhaustion reversal, but as an acceleration signal that traps premature dip-buyers.
To protect capital, disciplined participants wait for confirmation candles where daily closes reclaim the interior of the channel with shrinking volume before deploying an initial 30% position. Furthermore, secondary allocations (40%) should remain contingent upon breaking and defending the central 20-day simple moving average at $40.80, with dry powder preserved for horizontal retests near $36.00 if macro liquidity deteriorates.
Long-term wealth accumulation ultimately rewards rigorous position sizing over directional precision. Even within high-yield defensive blue chips, individual equity exposure should remain capped within total equity portfolio constraints, ensuring that transitory technical breakdowns never imperil broad retirement capital.
Related Portfolio Allocation & Balance Sheet Research
Examine complementary equity valuation models, technical moving average frameworks, and dividend sustainability guides across our institutional research database:
-
[Mega-Cap Semiconductor Analysis] Broadcom (AVGO) 200-Day Moving Average Support and RSI Rebound
Analyze institutional trendlines and oversold momentum reversals across high-cash-flow technology leaders.
-
[Defensive Dividend Royalties] McDonald’s Valuation Multiples and 3-Tier Staged Entry Model
Managing defensive consumer franchise positions through systematic valuation bands and payout ratio checks.
-
[Capital Efficiency Guide] Evaluating Corporate Economic Moats Through ROIC and Free Cash Flow
A structured framework for measuring enterprise reinvestment rates, capital preservation, and competitive advantage duration.
5. Frequently Asked Questions (FAQ)
What specific candle pattern confirms a valid reversal on the Verizon Bollinger Bands lower channel?
A valid reversal occurs when a daily candle trades outside the lower boundary but subsequently closes back inside the channel, preferably displaying a hammer pattern or an elongated lower wick on declining volume. This price action confirms that selling pressure has dried up and institutional buyers are absorbing floating supply.
How should investors handle a prolonged band riding breakdown?
When price action rides the lower band while the envelope widens, systematic dip-buying must be halted immediately. Allocators should hold existing positions and maintain capital in reserve until the bandwidth contracts, with secondary tranches reserved for the major historical horizontal floor near $36.00.
Is the standard 20-period and 2-standard-deviation setting optimal for utility and telecom equities?
Yes. The classical 20-day simple moving average with two standard deviations captures approximately one calendar month of trading sessions and accounts for 95.4% of normal price action. Shortening the window introduces market noise, while lengthening it delays signals beyond favorable risk-reward inflection points.
Regulatory & Investment Disclaimer
This research report is strictly for informational and educational purposes based on publicly available data. It does not constitute individualized investment advice, financial planning, or a solicitation to buy or sell securities. Past performance is no guarantee of future returns. Readers must conduct their own due diligence or consult a licensed fiduciary advisor.