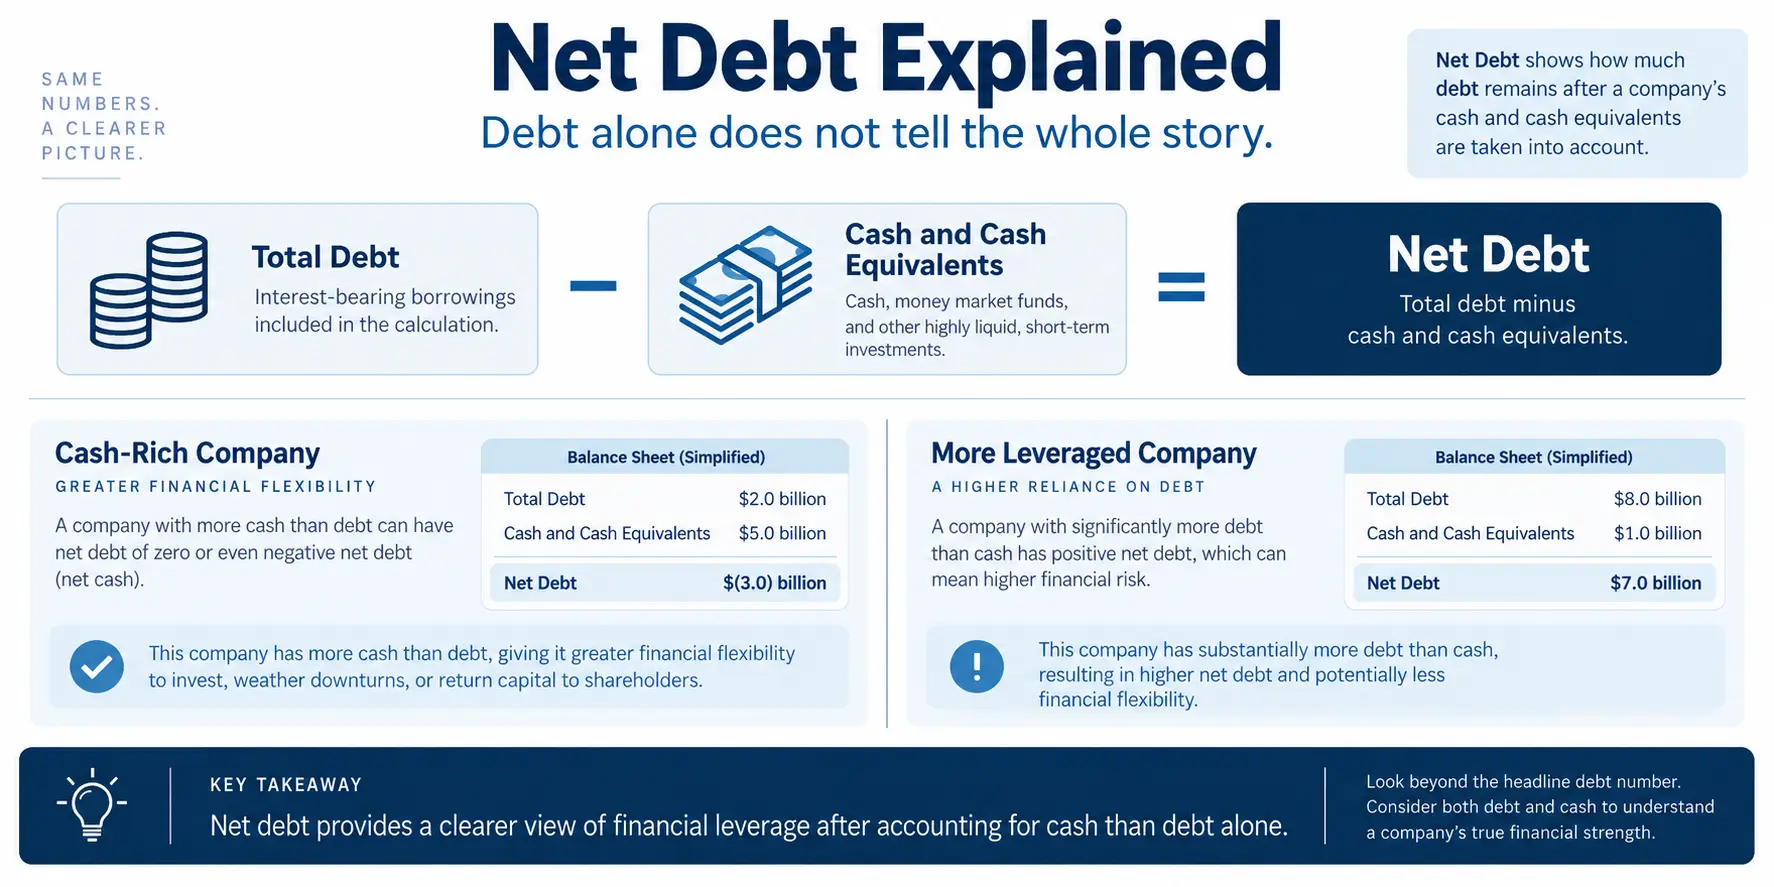
A company with a large amount of debt is not automatically in worse financial shape than a peer with less debt. The missing piece is often cash. A business may carry substantial borrowings while also holding enough cash and liquid assets to offset a meaningful portion of those obligations.
That is why net debt is useful in balance-sheet analysis. Instead of looking only at how much a company has borrowed, the metric asks a more practical question: how much debt remains after accounting for cash that can offset those borrowings?
Net debt helps investors compare financial leverage after accounting for cash, but it should not be treated as a complete measure of balance-sheet safety. Free cash flow, interest expense, debt maturities, refinancing needs, and returns on invested capital still matter.
What Is Net Debt?
At its simplest, net debt measures interest-bearing financial debt after subtracting cash and cash equivalents. If the calculation produces a positive number, the company has more debt than the cash being deducted. If it produces a negative number, the company is generally described as being in a net cash position under that particular definition.
| Item | What It Tells Investors |
|---|---|
| Interest-Bearing Debt | Borrowings such as short-term debt, current maturities, bonds, and long-term debt |
| Cash & Cash Equivalents | Immediately available liquidity that may offset financial obligations |
| Net Debt | The debt burden remaining after applicable cash or liquid assets are deducted |
| Net Cash | A position in which applicable cash exceeds the debt included in the calculation |
How to Calculate Net Debt
A useful starting formula is:
Net Debt = Short-Term Interest-Bearing Debt + Long-Term Interest-Bearing Debt − Cash & Cash Equivalents
This is a simplified analytical formula rather than a universally standardized accounting definition. The exact components can differ from one company to another.
For example, some companies deduct only cash and cash equivalents. Others also deduct marketable securities or certain short-term investments. Companies may also differ in how they treat lease liabilities and other financing obligations.
Dow provides a useful real-world example. In its 2025 Form 10-K filed with the SEC, the company describes net debt as a non-GAAP financial measure and calculates it by subtracting cash and cash equivalents and marketable securities from gross debt. At December 31, 2025, Dow reported $18.161 billion of gross debt, $3.816 billion of cash and cash equivalents, and $385 million of marketable securities, resulting in $13.960 billion of net debt. Investors can review the Dow 2025 Form 10-K and its net debt reconciliation directly.
Methodology matters: Before comparing two companies, check what each company includes in debt and what it subtracts as cash or liquid investments. Two figures labeled “net debt” may not be perfectly comparable if their definitions differ.

This simplified formula shows the basic logic behind net debt. Actual company definitions may also adjust for marketable securities, lease liabilities, or other financial items, so investors should check the company’s filing before comparing peers.
Net Debt Is Not the Same as Total Liabilities
One of the easiest mistakes to make is subtracting cash from total liabilities on the balance sheet and calling the result net debt.
Total liabilities can include accounts payable, accrued expenses, deferred revenue, tax liabilities, and other obligations created through normal business operations. These are not automatically the same as interest-bearing borrowings.
For a basic net debt analysis, investors generally start with financing obligations such as short-term borrowings, current portions of long-term debt, bonds, and long-term debt. The specific filing should then be checked for company-specific adjustments.
This distinction matters because using total liabilities instead of financial debt can materially distort comparisons between companies with different working-capital structures.
Why Cash Can Change the Debt Picture
Consider two hypothetical companies. Each has $100 million of interest-bearing debt. Looking only at gross borrowings, their leverage appears identical.
Now assume Company A holds $80 million in cash and cash equivalents, while Company B holds only $20 million.
| Illustrative Metric | Company A | Company B |
|---|---|---|
| Interest-Bearing Debt | $100M | $100M |
| Cash & Cash Equivalents | $80M | $20M |
| Net Debt | $20M | $80M |
The gross debt figure is identical, but the resulting balance-sheet positions are not. Company A has $20 million of net debt under this simplified calculation, compared with $80 million for Company B.
This does not automatically make Company A the better investment. Companies need working cash to run their businesses, and some cash may already be earmarked for capital expenditures, acquisitions, dividends, share repurchases, or other commitments. The example simply demonstrates why gross borrowings alone can provide an incomplete picture.
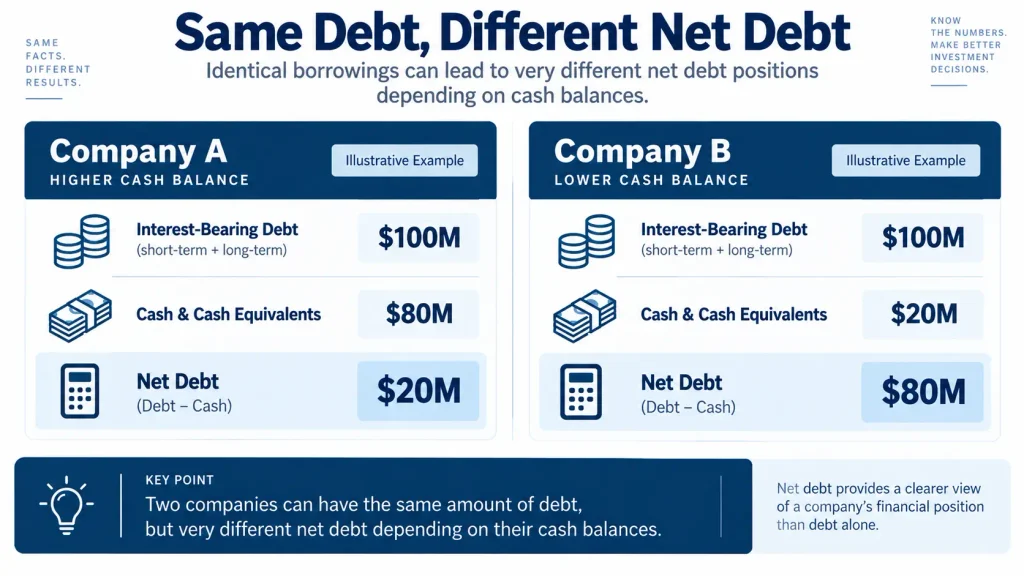
Illustrative example only. Both companies carry $100 million of interest-bearing debt, but different cash balances produce very different net debt positions. These figures are hypothetical and are not actual company results.
Is Lower Net Debt Always Better?
No. A lower figure can indicate greater financial flexibility, but it does not automatically mean the underlying business is more profitable, better managed, or more attractive at its current valuation.
A cash-rich company could generate weak returns on capital or allow excess cash to sit idle for years. Another company may operate with more debt while producing consistent cash flow and earning strong returns on the capital invested in the business.
The more useful question is not simply whether debt is high or low. Investors should ask whether the business can comfortably service its obligations and whether the capital financed by that debt is producing adequate economic returns.
1. Compare Debt With Free Cash Flow
A company with meaningful borrowings but strong and repeatable free cash flow may have substantial capacity to reduce debt over time. A business with weaker cash generation may have fewer options even if its current balance-sheet position looks manageable.
For example, a company carrying $100 million of debt after cash adjustments while consistently generating $50 million of annual free cash flow is in a different position from a company with the same debt burden but little or no free cash flow. This is an illustrative comparison rather than a rule that debt can necessarily be repaid with all available FCF.
For a deeper look at how operating cash flow and capital expenditures translate into cash available after investment, see the Smart Asset Desk Free Cash Flow Guide.
2. Check Interest Expense and the Maturity Schedule
Two companies can report similar debt balances and still face very different financing risks.
One may have long-dated fixed-rate bonds issued at relatively favorable rates. Another may face substantial maturities in the next few years and need to refinance at less favorable borrowing costs. The second company can experience rising interest expense even without materially increasing the amount it owes.
After measuring the debt burden, review the maturity schedule, borrowing rates, interest expense, liquidity sources, and the company’s ability to cover financing costs from operating earnings and cash flow.
3. Ask What the Borrowed Capital Is Producing
Debt is a financing tool, not automatically a sign of a weak business. A company may borrow to build manufacturing capacity, acquire another business, expand data-center infrastructure, or fund other projects expected to generate future returns.
The key question is whether those investments produce adequate returns relative to the capital required to support them. Return on invested capital can help investors examine that relationship.
ROE can also be influenced by leverage and changes in shareholders’ equity, which makes it useful to examine capital efficiency from more than one angle. The Smart Asset Desk ROE vs. ROIC analysis explains how the two metrics answer different questions about profitability and capital structure.
A Practical Balance-Sheet Checklist
1. Normalize the definition.
Determine which borrowings are included and which cash, securities, or investments are deducted. Use comparable definitions when evaluating peers.
2. Test the company’s ability to service debt.
Compare the balance-sheet burden with free cash flow, operating cash generation, interest expense, and near-term maturities.
3. Evaluate capital efficiency.
Determine whether the company is using borrowed and shareholder capital productively rather than assuming that a low debt balance automatically signals superior capital allocation.
What Net Debt Can Miss
The metric is useful precisely because it simplifies the balance sheet, but that simplicity also creates limitations.
Not every dollar of reported cash is necessarily available for immediate debt repayment. Companies require liquidity for payroll, inventory, capital expenditures, acquisitions, dividends, buybacks, taxes, and other operating needs. A large cash balance therefore should not automatically be treated as excess cash.
The calculation can also obscure timing risk. A company may appear manageable on an aggregate basis while facing a concentrated maturity wall over the next several years. Refinancing those obligations could become more expensive if borrowing costs rise or the company’s credit quality deteriorates.
Finally, a single balance-sheet date provides only a snapshot. Tracking the metric across several reporting periods can reveal whether leverage is increasing because of acquisitions or capital spending, or declining because the business is consistently converting operating performance into cash and repaying debt.
How to Use Net Debt in Company Analysis
A useful analysis does not stop with the balance sheet. One practical sequence is to identify interest-bearing debt, adjust it for applicable cash and liquid assets, examine free cash flow, review interest expense and debt maturities, and then evaluate how efficiently the company is using its capital.
In other words, the metric works best as a bridge between balance-sheet leverage and business economics. It helps answer how much financial debt remains after liquid resources are considered. FCF helps answer whether the business is generating cash to support or reduce that burden. Debt maturities reveal when refinancing pressure may emerge, while ROIC provides another perspective on whether the capital employed in the business is generating adequate returns.
Used together, these measures provide a more complete picture than simply labeling a company “safe” because it holds cash or “risky” because it carries debt.
FAQ
What is a good net debt level?
There is no universal number that qualifies as good. Appropriate leverage varies by industry, business stability, capital intensity, cash generation, and borrowing costs. The figure is more useful when compared with cash flow, earnings capacity, debt maturities, and relevant peers using comparable definitions.
Does net debt include all liabilities?
Not necessarily. A basic calculation usually focuses on interest-bearing financial debt rather than mechanically including every operating liability on the balance sheet. Accounts payable and accrued operating expenses, for example, are not automatically treated as debt in a standard calculation. Company definitions can still differ, so investors should review the relevant filing.
What does negative net debt mean?
A negative result generally means the cash and other qualifying liquid assets deducted under the chosen methodology exceed the debt included in the calculation. This is commonly described as a net cash position. It can provide financial flexibility, but it does not by itself establish business quality, profitability, valuation, or future investment returns.
Investment Disclaimer
This article is for educational and informational purposes only and does not constitute personalized investment advice or a recommendation to buy or sell any security. Net debt definitions can vary across companies, and financial conditions can change after a reporting date. Review the company’s latest SEC filings and investor-relations materials before making investment decisions. All investing involves risk, including the possible loss of principal.