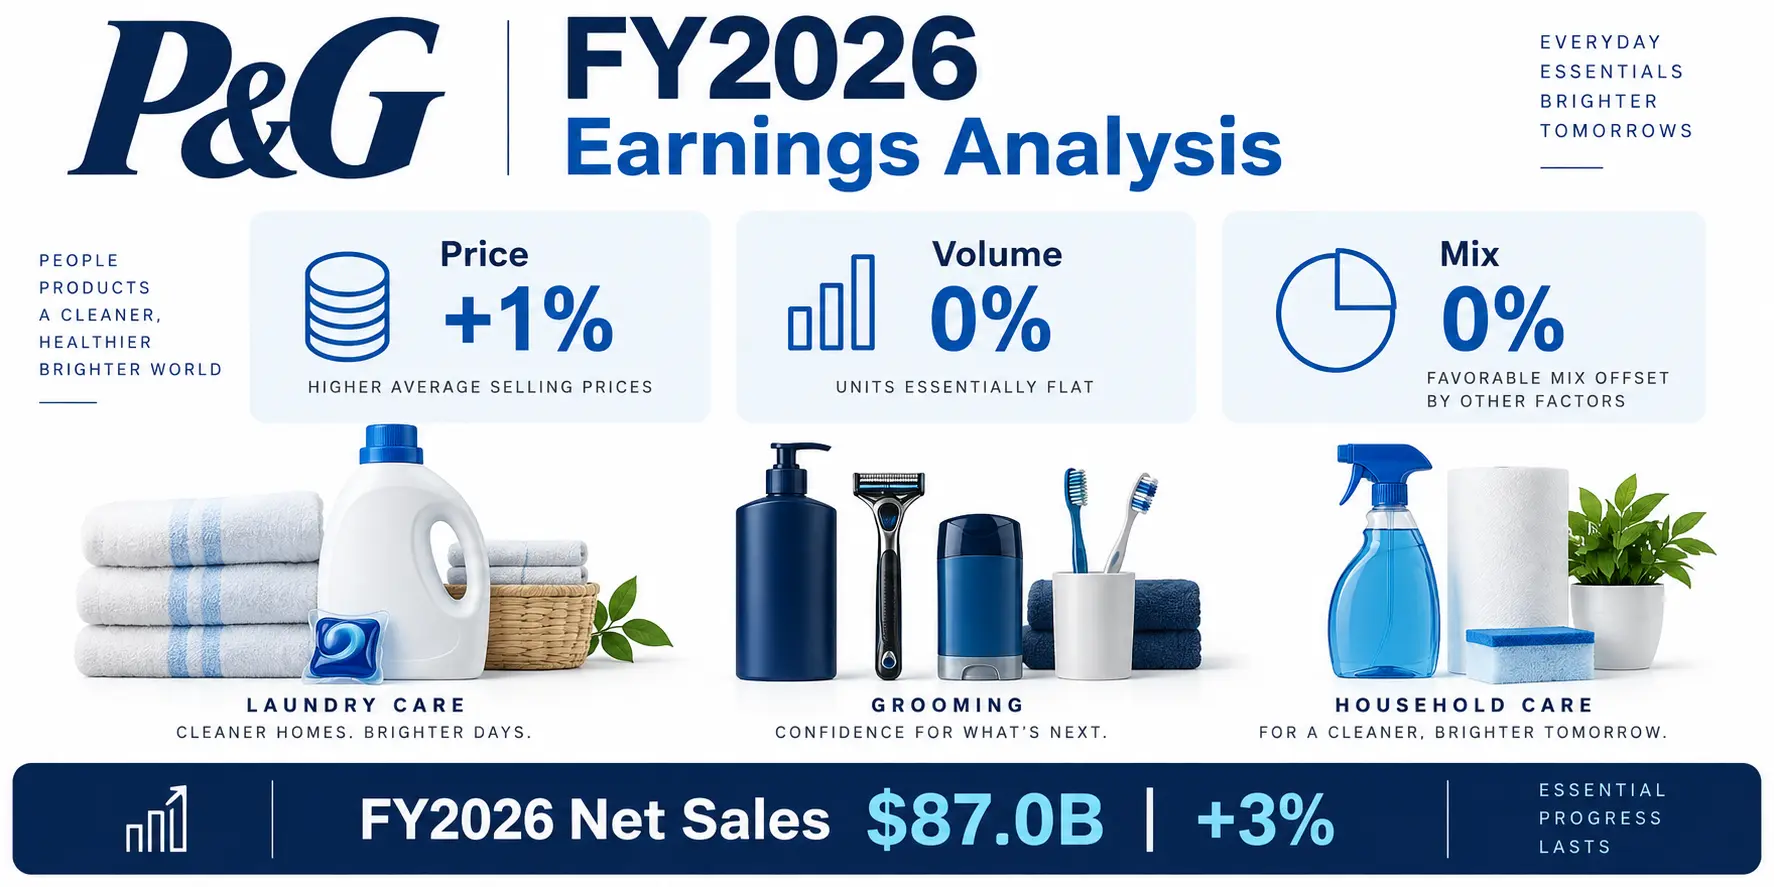
Procter & Gamble’s fiscal 2026 results offer a useful example of why investors should look beyond the headline revenue growth rate. P&G increased net sales by 3% to $87.032 billion, but the components of that growth tell a more informative story: favorable foreign exchange contributed 2%, higher pricing added 1%, and companywide volume and mix were unchanged.
This P&G earnings analysis focuses on those underlying sales drivers rather than treating 3% revenue growth as a single number. Breaking sales into price, volume and mix helps answer a more useful question for long-term investors: was P&G growing because it sold more products, charged more for them, shifted toward a better sales mix, or benefited from factors outside the underlying business?
The main takeaway from P&G’s FY2026 results is not simply that sales rose 3%. Pricing contributed 1% while companywide volume remained flat. That combination suggests P&G generated a positive pricing contribution without an overall decline in unit volume, although the results varied considerably across its business segments.
P&G earnings analysis: FY2026 results at a glance
| FY2026 Metric | Result | What It Tells Investors |
|---|---|---|
| Net Sales | $87.032B | Up 3% year over year |
| Organic Sales Growth | +1% | Excludes foreign exchange and acquisition/divestiture effects |
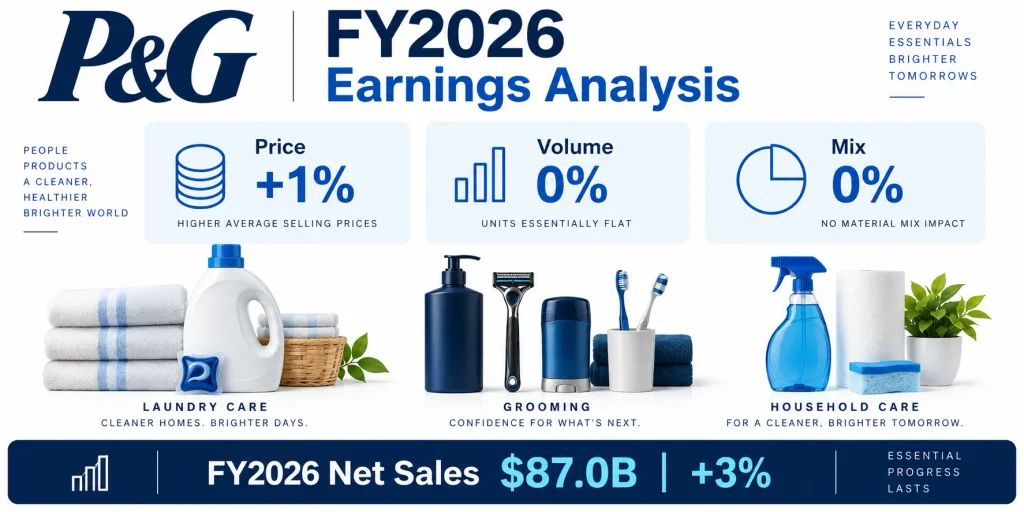
| Price | +1% | Higher pricing contributed to sales growth |
| Volume | 0% | Companywide unit volume was unchanged |
| Mix | 0% | Neutral at the company level |
| Gross Margin | 50.2% | Down 100 basis points from 51.2% |
| Operating Cash Flow | $19.556B | Up 10% year over year |
| Adjusted Free Cash Flow | $15.835B | P&G non-GAAP measure; adjusted FCF productivity was 100% |
The figures above cover the fiscal year ended June 30, 2026 and are based on P&G’s FY2026 earnings release and the company’s FY2026 Form 10-K filed with the SEC. The distinction between fiscal-year and quarterly data matters here: P&G’s fourth-quarter organic sales were flat, while organic sales for the full fiscal year increased 1%.
Why price, volume and mix matter more than the headline growth rate
Revenue growth can come from several different sources, and those sources do not necessarily carry the same implications for a consumer staples company. A business can grow by selling more units, raising prices, shifting sales toward higher-value products or markets, acquiring businesses, or benefiting from currency movements.
Price measures the contribution from changes in pricing. For a branded consumer products company, positive pricing can help offset higher input, labor, tariff or distribution costs. But pricing alone does not prove that a company has unlimited pricing power. If consumers respond by buying fewer units or switching to competitors, the benefit from higher prices can eventually be offset by weaker volume.
Volume helps investors see what happened to the quantity of products sold. A positive pricing contribution accompanied by stable volume can be more informative than pricing growth alone because it shows that companywide unit sales did not decline during the measured period.
Mix captures changes in the composition of sales. The mix of products, markets and other business components can affect reported revenue and margins even when aggregate unit volume changes little. Selling a greater proportion of higher-value products can produce a different economic result from generating the same revenue through lower-value categories.
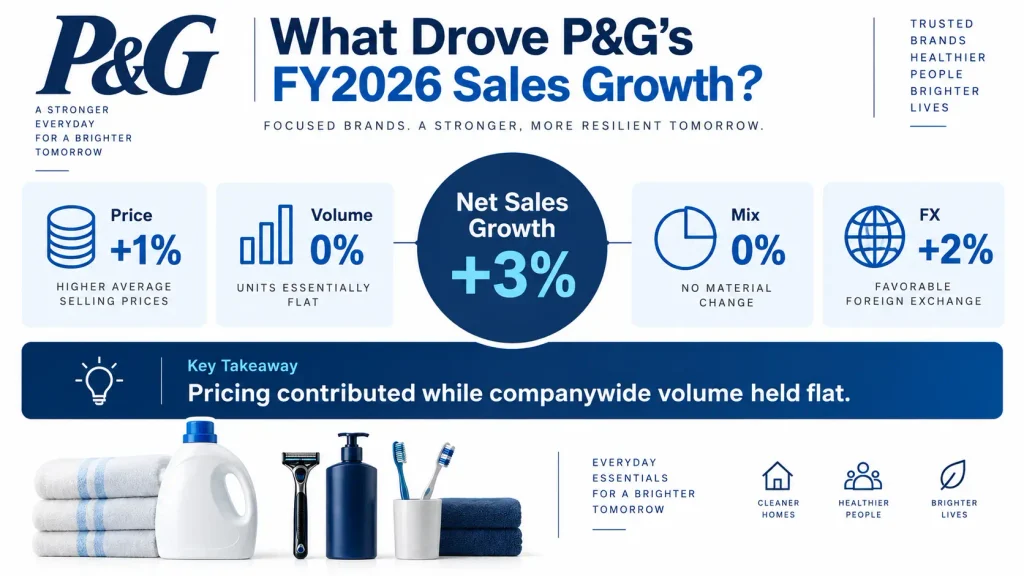
P&G’s FY2026 net sales increased 3%. Favorable foreign exchange contributed 2% and higher pricing contributed 1%, while companywide volume and mix were unchanged from the prior year.
What P&G’s flat volume actually tells us
The combination of Price +1% and Volume 0% is one of the more interesting features of P&G’s FY2026 results. At the company level, higher pricing contributed to sales without a year-over-year decline in unit volume.
That does not mean every P&G product successfully absorbed a price increase, nor does it establish that consumers will accept additional price increases indefinitely. Companywide figures can hide substantial differences among categories, regions and individual brands.
What the data does show is narrower and more useful: during FY2026, positive pricing and a companywide volume decline did not occur together. For a company selling frequently purchased household and personal-care products, that is worth monitoring because sustained volume weakness can eventually challenge the quality of price-led growth.
P&G’s portfolio includes recurring-use categories such as laundry care, home care, grooming, hair care and baby care. The company also emphasizes product performance, packaging, brand communication, retail execution and consumer value as parts of its competitive strategy. These factors help explain why evaluating pricing requires more than looking at the sticker price of an individual product.
The segment data shows why companywide averages can mislead
The strongest reason not to stop at P&G’s flat companywide volume figure is the variation underneath it. FY2026 sales drivers differed substantially across the company’s five reportable business segments. This part of the P&G earnings analysis is particularly important because the consolidated 0% volume figure masks both growth and contraction at the segment level.
| Segment | Volume | Price | Mix | Net Sales Growth |
|---|---|---|---|---|
| Beauty | +4% | +1% | 0% | +7% |
| Grooming | -1% | +2% | 0% | +4% |
| Health Care | -2% | +2% | +1% | +4% |
| Fabric & Home Care | 0% | +1% | 0% | +2% |
| Baby, Feminine & Family Care | -1% | 0% | 0% | +1% |
Beauty produced the strongest combination. Volume increased 4%, pricing contributed 1%, and net sales increased 7%. This is different from growth driven primarily by price because unit demand was also moving in a favorable direction.
Health Care tells a different story. Net sales increased 4%, but volume declined 2%. Positive pricing of 2%, favorable mix of 1%, and foreign exchange helped offset weaker unit volume. The final revenue growth rate therefore looks similar to Grooming’s 4% increase even though the underlying drivers were not identical.
Fabric & Home Care is especially important because of its size. The segment generated $30.314 billion of FY2026 net sales, roughly 35% of P&G’s companywide revenue. Volume was flat, pricing contributed 1%, and net sales increased 2%. Its scale means the segment is an important part of understanding why companywide volume finished the year unchanged.
Baby, Feminine & Family Care, meanwhile, recorded a 1% volume decline and 1% net sales growth. Within Family Care, net sales declined low single digits as lower pricing reflected merchandising investments and unit volume decreased due to competitive activity. This is a useful reminder that even a diversified consumer staples company can face different competitive pressures across categories.
P&G’s companywide volume was flat in FY2026, but segment results varied substantially. Beauty combined higher volume and pricing, while Health Care posted lower volume despite positive pricing and mix.
Pricing helped, but gross margin still fell
One of the most useful counterpoints to the sales data is P&G’s gross margin. If pricing contributed positively and volume held flat, investors might expect profitability to improve as well. That did not happen in FY2026.
Reported gross margin declined 100 basis points to 50.2% from 51.2% in the prior year. The largest negative factor was unfavorable product mix at 120 basis points. Product and packaging investments reduced margin by another 70 basis points, restructuring costs by 60 basis points, net tariff impact by 30 basis points, higher commodity costs by 20 basis points, unfavorable foreign exchange by 10 basis points, and other items and rounding by 10 basis points.
Those pressures totaled 320 basis points. They were partially offset by 180 basis points of manufacturing productivity savings and 40 basis points from higher pricing. The positive factors totaled 220 basis points, leaving a net 100-basis-point decline, consistent with the reported change in gross margin.
This reconciliation adds an important qualification to the pricing story. Higher prices helped P&G’s margin, but pricing alone was not enough to overcome unfavorable mix and other cost pressures. Revenue growth and margin expansion are related, but they are not the same thing. For a broader methodology on separating pricing, cost efficiency and product mix, see the Smart Asset Desk guide to analyzing gross margin.
Cash flow adds another layer to the earnings analysis
The income statement is only part of the picture. P&G generated $19.556 billion of operating cash flow in FY2026, up 10% from $17.817 billion in the prior year. P&G’s non-GAAP adjusted free cash flow was $15.835 billion, up from $14.606 billion in FY2025, and adjusted free cash flow productivity was 100%.
P&G defines adjusted free cash flow as operating cash flow less capital spending and excluding payments for the transitional tax resulting from the 2017 U.S. Tax Act. This distinction matters because the company’s adjusted free cash flow figure should not be treated as an interchangeable label for a generic GAAP cash-flow subtotal.
P&G also paid $10.232 billion in cash dividends during the fiscal year. Following its April 2026 dividend increase, the company reached 70 consecutive years of dividend increases and 136 consecutive years of dividend payments since incorporation.
The dividend record is notable, but the more useful analytical question is whether the business continues to generate enough cash to support shareholder distributions while funding operations and investment. Historical dividend streaks describe what a company has done; cash generation helps investors evaluate its capacity to keep funding capital allocation priorities. Readers who want to extend this analysis can review the Smart Asset Desk free cash flow guide for the relationship between operating cash flow, capital expenditures and cash available after reinvestment.
Three things to watch in P&G’s next earnings reports
1. Watch price and volume together. Positive pricing is more informative when unit volume remains stable. Persistent volume declines would make price-led revenue growth less attractive.
2. Look below the companywide average. FY2026 volume was flat for P&G overall, but individual segments ranged from Beauty at +4% to Health Care at -2%. Segment trends can reveal changes that disappear in the consolidated number.
3. Connect sales growth to margins and cash flow. FY2026 demonstrated that positive pricing does not automatically produce higher gross margin. Product mix, commodities, tariffs, reinvestment and productivity can materially change the outcome.
Bottom line: what this P&G earnings analysis shows
P&G’s FY2026 results show why revenue decomposition can improve company analysis. Net sales increased 3%, but 2 percentage points came from favorable foreign exchange and 1 percentage point came from higher pricing. Companywide volume and mix were unchanged.
There are positive elements in that result. Pricing contributed to growth without an overall decline in unit volume, Beauty produced both volume and pricing growth, and operating cash flow increased 10%. At the same time, Health Care and other areas experienced weaker volume, while companywide gross margin declined 100 basis points despite pricing and manufacturing productivity benefits.
For investors following PG stock, the next step is not simply to ask whether P&G can raise prices again. A more informative approach is to track price, volume, mix, gross margin and cash flow together. If pricing remains positive while volume holds up and productivity offsets cost pressure, the quality of growth may improve. If volume weakens or unfavorable mix continues to pressure margins, headline sales growth could tell a less favorable story than it first appears.
Frequently asked questions
Did P&G raise prices without losing sales volume in FY2026?
At the company level, higher pricing contributed 1% to FY2026 net sales growth while unit volume was unchanged from the prior year. That does not mean every product or segment maintained volume. Beauty volume increased 4%, while Health Care volume declined 2% and Baby, Feminine & Family Care volume declined 1%.
What is the difference between price and mix in P&G’s earnings?
Price measures the sales impact associated with pricing changes. Mix reflects changes in the composition of sales, such as the relative contribution of different products, markets or business components. Both can affect revenue even when overall unit volume is unchanged.
Why did P&G’s gross margin fall if pricing increased?
Higher pricing added 40 basis points to FY2026 gross margin and manufacturing productivity added 180 basis points, but those benefits were outweighed by unfavorable product mix and several cost pressures. Reported gross margin therefore declined 100 basis points to 50.2%.
Investment Disclaimer
This article is for informational and educational purposes only and does not constitute individualized investment, tax, or financial advice or a recommendation to buy or sell any security. Financial data reflects the reporting periods identified in the article and may change in subsequent filings. Market conditions and company fundamentals can change. Investors should conduct their own research and consider their objectives, time horizon, and risk tolerance before making investment decisions.