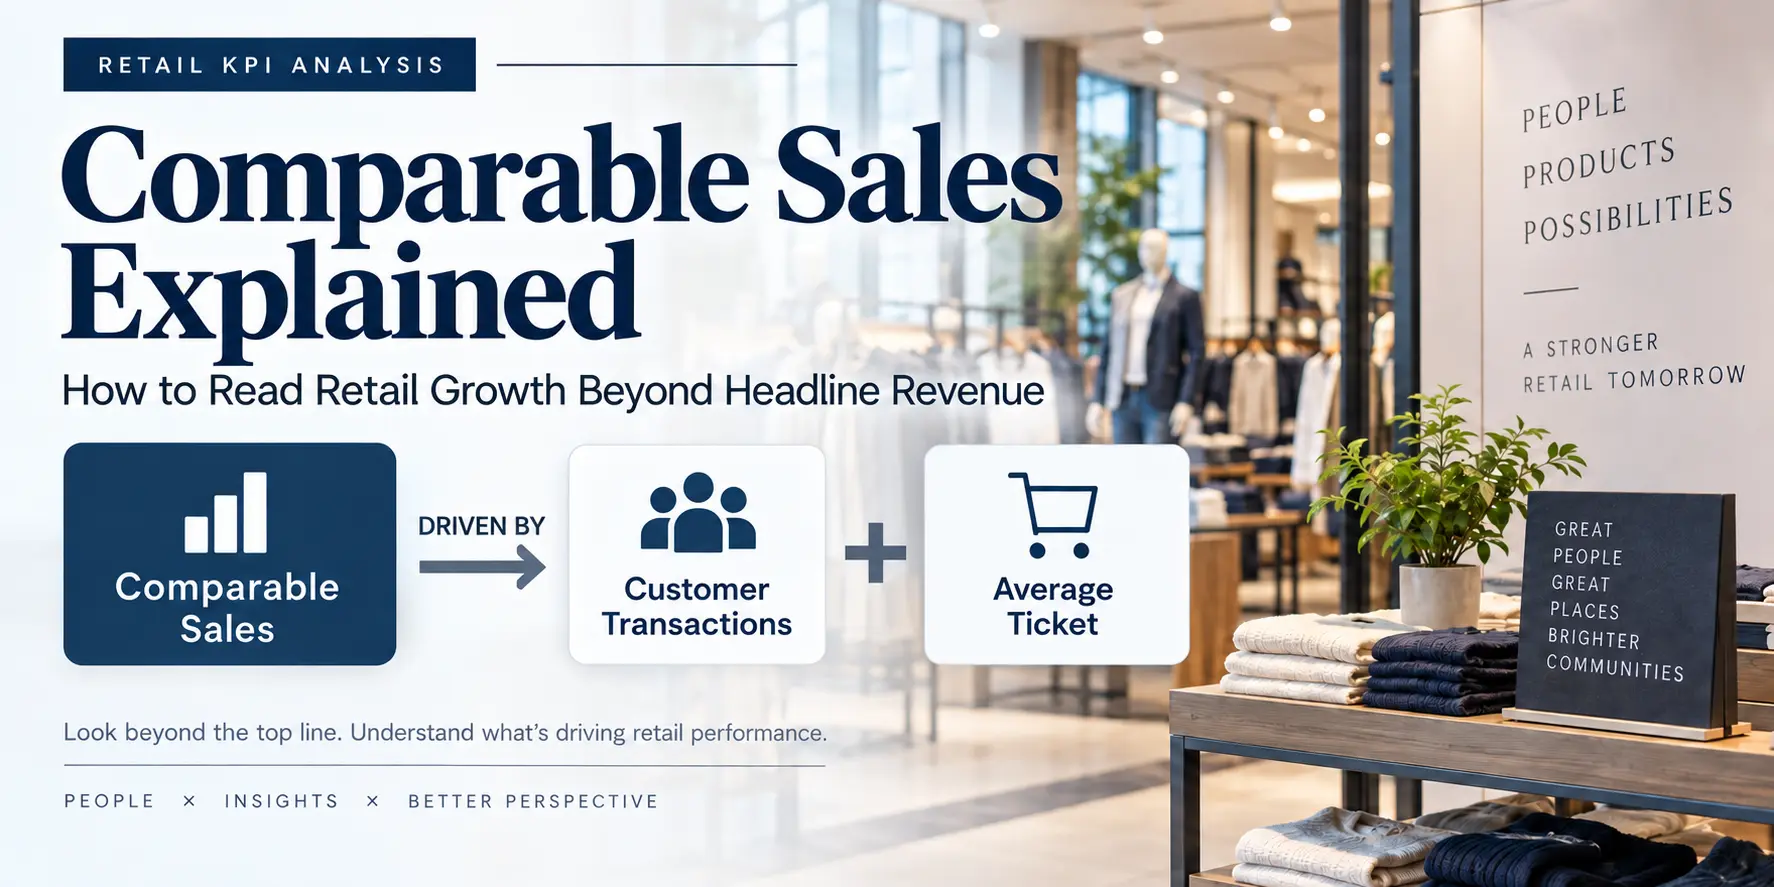
Retail revenue growth can be deceptively simple. A company reports higher sales, investors see a positive percentage, and the initial conclusion is that the business is selling more. But for retailers such as Home Depot, Walmart, and Target, headline revenue growth does not tell you whether established stores are actually performing better.
That is where comparable sales become useful. Often called same-store sales, this metric helps investors separate growth from an existing retail base from growth created by factors such as new locations and acquisitions.
The number still needs context. A positive comparable-sales figure can come from more customer transactions, higher spending per transaction, or a combination of both. Those scenarios can tell very different stories about underlying consumer demand.
The practical takeaway: Do not stop at the comparable-sales growth rate. Check customer transactions and average ticket, then connect those trends to margins and profitability.
What Are Comparable Sales?
Comparable sales measure the change in sales generated by a retailer’s established comparable business versus an equivalent prior period. The metric is designed to help investors evaluate how the existing retail base is performing without treating every source of consolidated revenue growth as the same type of growth.
The exact definition is company-specific. A retailer may have rules governing how long a location must be open before it enters the comparable base, whether digital sales are included, how remodeled or relocated stores are treated, and when acquired businesses become comparable.
That distinction matters because consolidated revenue can rise even when mature stores are barely growing.
Suppose a retailer operated 100 stores last year and added 20 stores this year. Those new locations can generate additional revenue even if sales across the original store base are unchanged. An investor looking only at total revenue growth could therefore overestimate the improvement in the established business.
Comparable sales provide another lens.
| Metric | What It Helps Measure | Question for Investors |
|---|---|---|
| Total Revenue Growth | Growth across the consolidated business | How fast is the company growing overall? |
| Comparable Sales | Performance of the comparable retail base | Are established operations generating more sales? |
| Customer Transactions | Change in transaction activity | Are customers completing more or fewer purchases? |
| Average Ticket | Average spending per transaction | Is spending per purchase rising or falling? |
Comparable Sales Are Not Standardized Across Retailers
One of the biggest mistakes investors can make is assuming that every retailer calculates comparable sales the same way.
Home Depot, for example, defines comparable sales using sales from physical and online locations that have been open for more than 52 weeks, including remodels and relocations, while excluding closed stores. Acquisitions are typically added to the comparable-sales base after Home Depot has owned them for more than 52 weeks.
The company also explicitly states that comparable sales are supplemental information rather than a substitute for GAAP net sales, and that calculation methods vary across the retail industry.
This means a 4% comparable-sales increase at one retailer should not automatically be treated as economically superior to a 3% increase at another retailer. Investors should first understand what each company includes in the calculation.
Home Depot’s methodology and current comparable-sales discussion can be reviewed directly in its FY2026 second-quarter Form 10-Q.
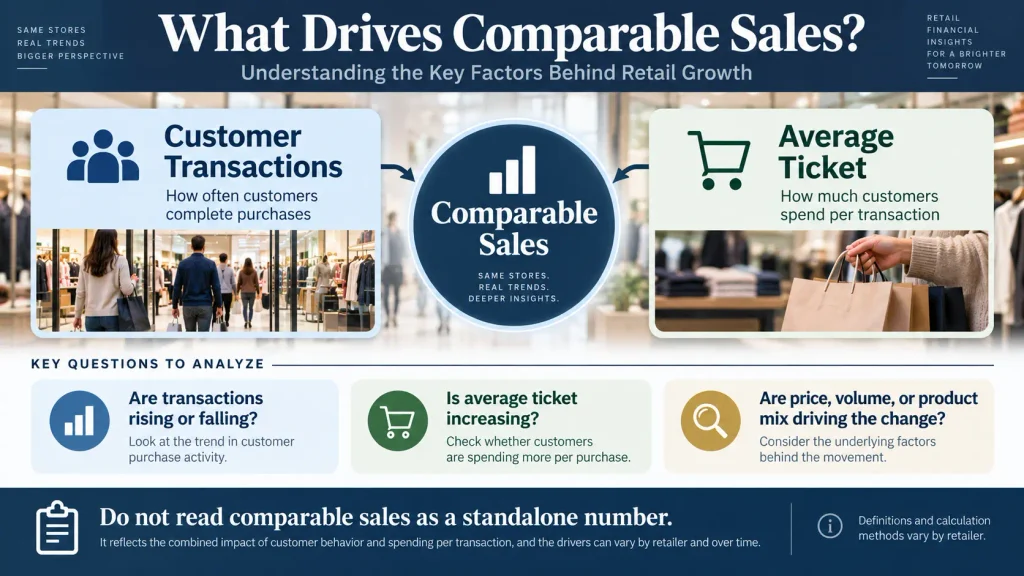
Comparable sales become more informative when investors look beneath the headline growth rate. Transaction trends help show changes in purchase activity, while average ticket shows how much customers spend per transaction.
The Two Metrics to Check After Comparable Sales
Once you know whether comparable sales increased or decreased, the next question is more important: what produced that change?
For many retailers, two operating metrics provide useful clues: customer transactions and average ticket.
Customer Transactions
Transaction data help show whether customers are completing more or fewer purchases across the measured business.
Rising transactions can be consistent with stronger purchase activity, although the reason still requires investigation. Falling transactions may reflect softer demand, changes in consumer behavior, price sensitivity, competitive pressure, or other factors.
Investors should also be careful with terminology. Some companies report transactions, while others discuss traffic. The concepts can be related, but they are not automatically interchangeable. A company’s own definition should take priority over a generic interpretation.
Average Ticket
Average ticket measures the average amount paid per transaction. An increase can come from several sources: higher prices, customers buying more items, a shift toward higher-priced products, or some combination of these factors.
That is why higher average ticket should not automatically be labeled as pricing power.
If average ticket rises while transactions decline, the retailer can still report positive comparable sales. But that result tells a different demand story than one in which both transactions and average ticket are increasing.
This breakdown is closely related to the broader question of what drives top-line growth. Our guide to analyzing revenue growth through price, volume, and mix explains how investors can separate the components behind a reported sales increase before moving deeper into industry-specific KPIs such as comparable sales.
Home Depot’s FY2026 Q2 Shows Why the Breakdown Matters
Home Depot’s fiscal 2026 second quarter provides a useful real-world example. The quarter ended August 2, 2026.
The company reported $47.861 billion in net sales, up 5.7% from the prior-year quarter. Comparable sales increased 1.7%, while U.S. comparable sales increased 1.3%.
| Home Depot FY2026 Q2 | Reported Result | What It Tells Us |
|---|---|---|
| Net Sales | $47.861 billion | Total company sales |
| Net Sales Growth | +5.7% | Overall revenue growth |
| Comparable Sales | +1.7% | Growth across the comparable business |
| U.S. Comparable Sales | +1.3% | Comparable growth in the U.S. |
| Comparable Customer Transactions | -1.0% | Fewer comparable transactions |
| Comparable Average Ticket | +2.8% | Higher spending per comparable transaction |
| Average Ticket | $92.50 | Average amount paid per reported transaction |
The headline comparable-sales result was positive, but the components moved in opposite directions.
Comparable customer transactions fell 1.0%, while comparable average ticket increased 2.8%. Home Depot said the 1.7% increase in total comparable sales primarily reflected the higher comparable average ticket, partially offset by the decline in comparable customer transactions.
This distinction changes the interpretation. Saying that Home Depot’s existing demand simply “grew 1.7%” would hide an important part of the quarter: transaction activity declined while spending per transaction increased.
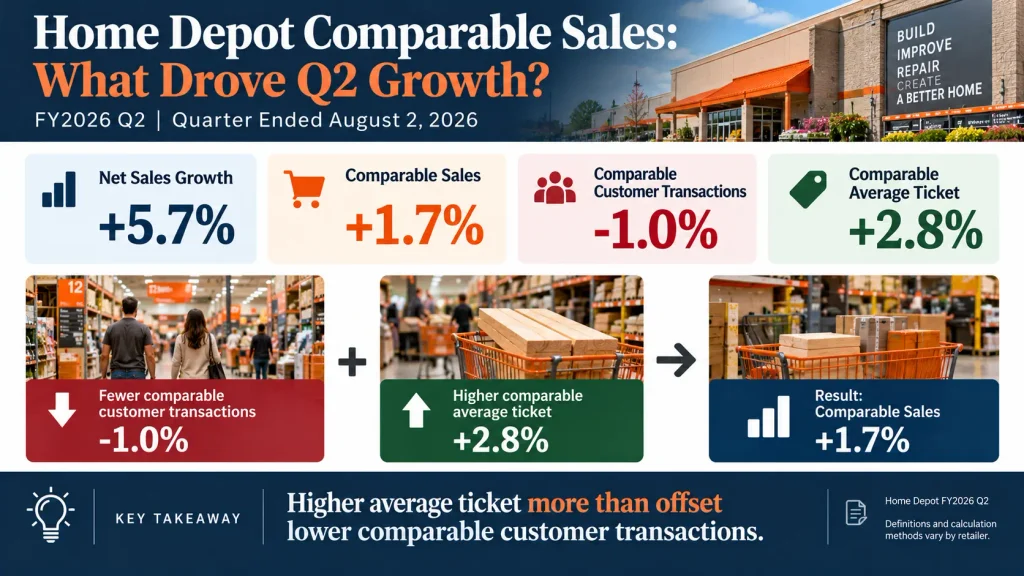
Home Depot’s FY2026 second quarter illustrates why the headline comparable-sales figure needs context. Comparable sales rose 1.7% even as comparable customer transactions declined 1.0%, because comparable average ticket increased 2.8%.
Why Total Sales Grew Much Faster Than Comparable Sales
Home Depot’s quarter also demonstrates why investors should not treat total revenue growth and comparable-sales growth as interchangeable.
Net sales increased 5.7%, considerably faster than the 1.7% increase in comparable sales.
The company’s Form 10-Q provides important context. Home Depot said second-quarter net sales growth was primarily driven by sales from GMS, which it acquired in September 2025 and which contributed approximately $1.4 billion of incremental net sales during the quarter. The company also cited its positive comparable-sales environment, the Mingledorff’s acquisition, and sales from new stores and branches.
This is exactly the analytical problem comparable sales are intended to help solve. Consolidated sales tell investors how much revenue the company generated. Comparable sales help isolate a different question: how did the established comparable business perform?
A Positive Comp Does Not Automatically Mean Stronger Customer Demand
Comparable-sales growth is useful, but its interpretation depends on what is happening underneath it.
Consider three different situations.
Scenario one: transactions rise and average ticket rises. Both purchase activity and spending per transaction are moving in a favorable direction. Investors would still need to investigate pricing, mix, promotions, and margins, but the sales composition is relatively broad.
Scenario two: transactions fall while average ticket rises. Comparable sales may remain positive, but higher spending per transaction is doing more of the work. Home Depot’s FY2026 second quarter fits this general pattern.
Scenario three: transactions rise but margins deteriorate. Promotions or discounting may be helping generate sales activity without producing the same improvement in profitability.
None of these situations can be understood from the headline comparable-sales percentage alone.
Connect Comparable Sales to Margins
The next step is to move from sales performance to economics.
A retailer can generate higher comparable sales and still experience weaker profitability. That is why the analysis should continue beyond the sales line. Our operating leverage guide explains how changes in revenue can translate into much larger—or smaller—changes in operating profit depending on the company’s cost structure.
Promotions can support transactions while pressuring gross margin. Labor, occupancy, technology, distribution, or other operating costs can also rise faster than revenue.
Home Depot again provides a useful example. Based on its reported second-quarter results, gross profit was $16.115 billion on $47.861 billion of net sales, equivalent to a gross margin of about 33.7%. The prior-year quarter was approximately 33.4%.
Operating income was $6.839 billion, producing an operating margin of roughly 14.3%, compared with approximately 14.5% in the prior-year quarter.
In other words, the quarter included positive comparable-sales growth and a modestly higher gross margin, while operating margin was slightly lower year over year. That is a reminder that sales KPIs and final operating profitability do not always move together.
A Better Way to Analyze Retail Earnings
For a retail company, a practical earnings-review sequence is:
- Start with total net sales and the year-over-year growth rate.
- Compare that result with comparable sales.
- Read the company’s exact definition of comparable sales.
- Check customer transactions or traffic, depending on what the company reports.
- Check average ticket or the company’s equivalent metric.
- Investigate whether pricing, unit volume, product mix, or promotions influenced the result.
- Review gross margin and operating margin.
- Then examine operating cash flow and free cash flow when evaluating the broader financial picture.
This sequence prevents a common analytical shortcut: treating every percentage point of revenue growth as evidence of stronger underlying customer demand.
The final step is cash conversion. Revenue and operating profit do not necessarily translate into free cash flow at the same rate, particularly when working capital or capital spending changes. The Smart Asset Desk guide to free cash flow margin explains how to connect revenue with the cash a business retains after capital expenditures.
What Investors Should Watch in Future Quarters
The direction of comparable sales matters, but the composition of that growth can be even more informative over multiple quarters.
If comparable sales remain positive while transactions repeatedly decline, investors can ask whether average-ticket growth is sustainable and what is driving it. If transactions recover, the question becomes whether the improvement is occurring without excessive discounting. If sales improve but operating margins weaken, the cost structure deserves closer attention.
Home Depot’s own commentary adds another layer. In its FY2026 second-quarter filing, the company said comparable-sales results reflected customer engagement with smaller repair and maintenance projects despite consumer uncertainty and housing-affordability pressure on home-improvement demand.
That context is useful because a retail KPI should not be interpreted in isolation from the market the company serves.
The Bottom Line on Comparable Sales
Comparable sales are one of the most useful operating metrics in retail analysis because they help investors look beyond consolidated revenue growth. But the metric is most valuable when treated as the beginning of the analysis rather than the conclusion.
First ask whether comparable sales are rising or falling. Then determine whether transactions and average ticket are moving in the same direction. After that, check margins to see whether sales growth is translating into better economics.
Home Depot’s FY2026 second quarter demonstrates the value of this approach: total net sales rose 5.7%, comparable sales increased 1.7%, comparable customer transactions declined 1.0%, and comparable average ticket increased 2.8%. Each number is accurate on its own, but together they provide a much clearer picture of the quarter.
For the underlying company data and methodology, see Home Depot’s FY2026 second-quarter earnings release and Form 10-Q.
FAQ
What does comparable sales mean?
Comparable sales generally measure sales growth across a retailer’s established comparable business versus an equivalent prior period. The exact methodology varies by company, so investors should read the retailer’s own definition before making peer comparisons.
Are comparable sales the same as same-store sales?
The terms are often used to describe similar retail performance concepts, but they should not automatically be assumed to have identical definitions. A company’s calculation may include digital sales, relocated stores, remodeled locations, or other business components depending on its methodology.
Can comparable sales increase when customer transactions decline?
Yes. Home Depot’s FY2026 second quarter is a clear example. Comparable sales increased 1.7% while comparable customer transactions declined 1.0% and comparable average ticket increased 2.8%. Higher spending per comparable transaction can offset lower transaction activity.
Investment Disclaimer
This article is for educational and informational purposes only and does not constitute investment advice or a recommendation to buy or sell any security. Financial results and operating metrics can change over time. Investors should review the latest company filings and consider their own objectives and risk tolerance before making investment decisions.