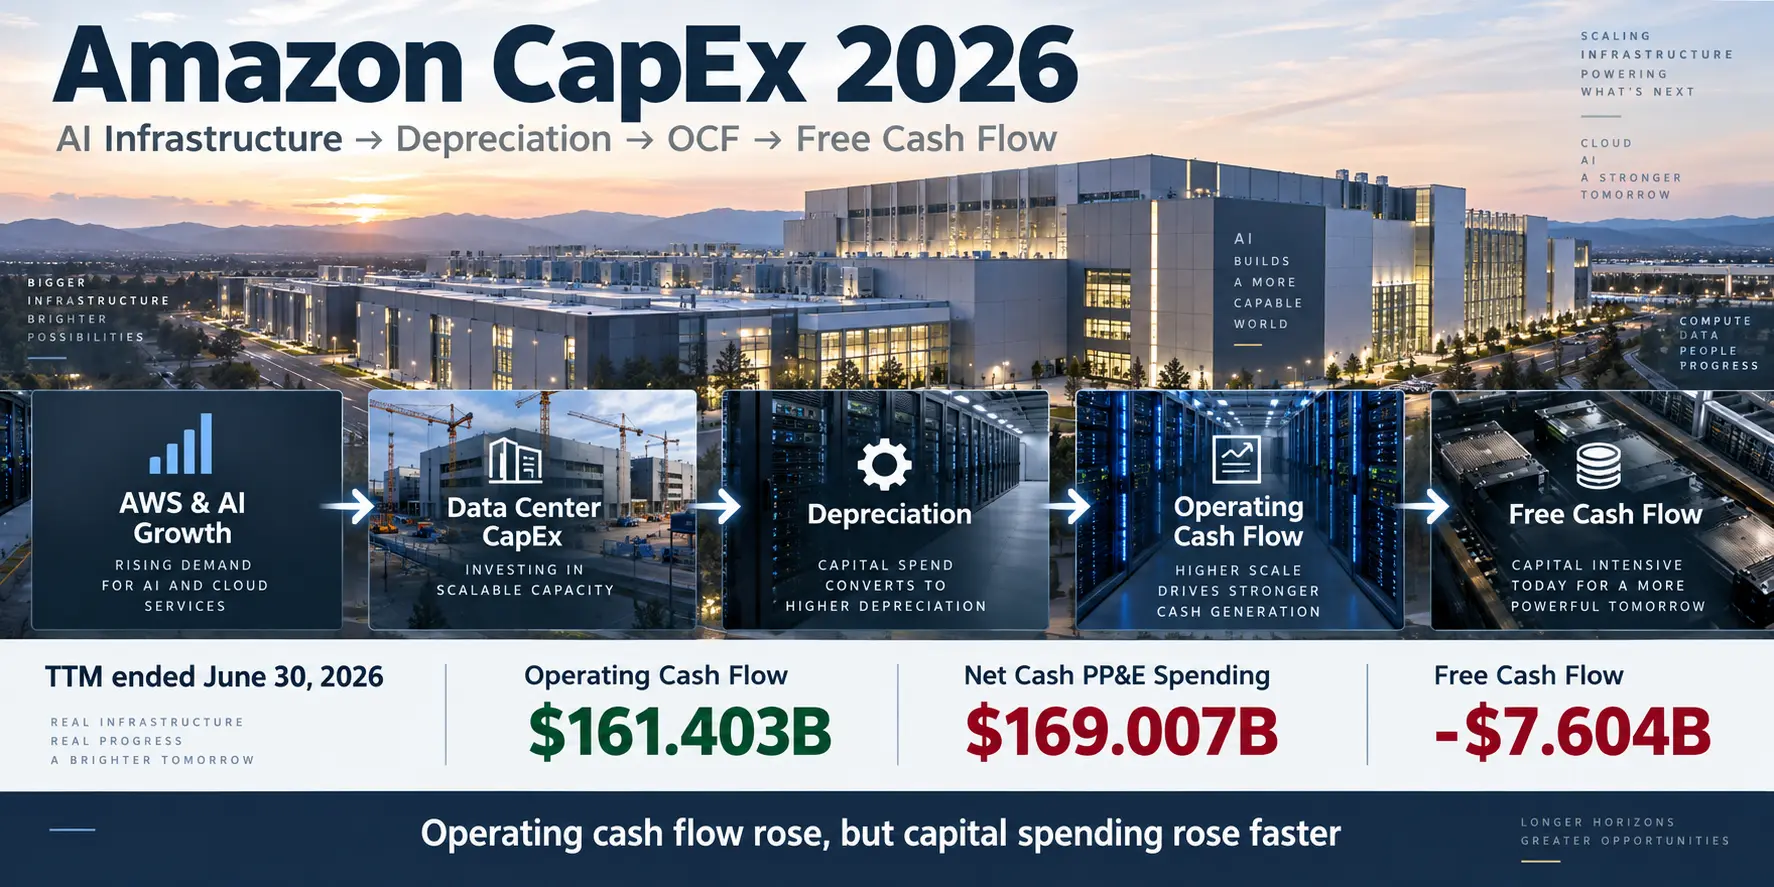
Amazon CapEx has become one of the most important numbers for investors trying to understand the economics of the company’s AI buildout. AWS is growing rapidly, but serving that demand requires Amazon (NASDAQ: AMZN) to commit enormous amounts of cash to data centers, servers, networking equipment, power infrastructure, and other computing assets before those investments can generate returns.
The cash-flow statement captures that tension clearly. For the trailing twelve months ended June 30, 2026, Amazon generated $161.403 billion of operating cash flow, up roughly 33.2% from the prior-year period. Yet purchases of property and equipment, net of proceeds from sales and incentives, climbed to $169.007 billion. Amazon-reported free cash flow consequently moved from an $18.184 billion inflow to a $7.604 billion outflow.
Amazon’s negative TTM free cash flow was not caused by a decline in operating cash flow. Operating cash generation increased substantially, but cash spending on property and equipment increased much faster.
Amazon CapEx: The Numbers Investors Should Separate
The easiest mistake in analyzing Amazon’s investment cycle is treating every property-and-equipment figure as the same type of CapEx. Amazon reports several related numbers, but they answer different questions.
| Metric | Prior Period | 2026 Period | Why It Matters |
|---|---|---|---|
| Q2 AWS revenue | $30.873B | $42.232B | About 36.8% YoY growth |
| H1 AWS net PP&E additions | $36.507B | $90.120B | Includes cash and non-cash activity |
| H1 AWS allocated D&A | $9.234B | $15.353B | About 66.3% higher |
| TTM operating cash flow | $121.137B | $161.403B | About 33.2% higher |
| TTM net cash PP&E spending | $102.953B | $169.007B | About 64.2% higher |
| TTM free cash flow | +$18.184B | -$7.604B | Cash investment exceeded OCF |
The figures above use Amazon’s quarter, first-half, and trailing-twelve-month periods ended June 30, 2026. The underlying data can be reviewed in Amazon’s Q2 2026 earnings release and its Form 10-Q filed with the SEC.
AWS Growth Is Driving a Much Larger Infrastructure Base
AWS revenue reached $42.232 billion in Q2 2026, up from $30.873 billion a year earlier. Amazon described the 37% reported growth rate as AWS’s fastest growth in 18 quarters. Management also said both the AWS AI business and the company’s chips business had exceeded annual revenue run rates of $25 billion.
That growth does not happen without physical infrastructure. Cloud and AI workloads require servers, accelerators, networking equipment, data-center facilities, power, and cooling capacity. Amazon’s 10-Q says the majority of technology infrastructure assets are allocated to AWS based on usage.
The scale of that buildout is visible in AWS net additions to property and equipment. Those additions increased from $36.507 billion in the first half of 2025 to $90.120 billion in the first half of 2026, an increase of approximately 146.9%.
There is an accounting distinction that matters here: $90.120 billion is not the same thing as cash CapEx. Amazon states that net additions include non-cash activity, such as property and equipment acquired but not yet paid, along with finance-lease additions.
For the six months ended June 30, 2026, Amazon reported $98.411 billion of cash purchases of property and equipment and $2.101 billion of proceeds from property and equipment sales and incentives. The net cash amount was therefore approximately $96.310 billion. That cash figure is the more relevant measure when tracing the effect of capital spending into free cash flow.
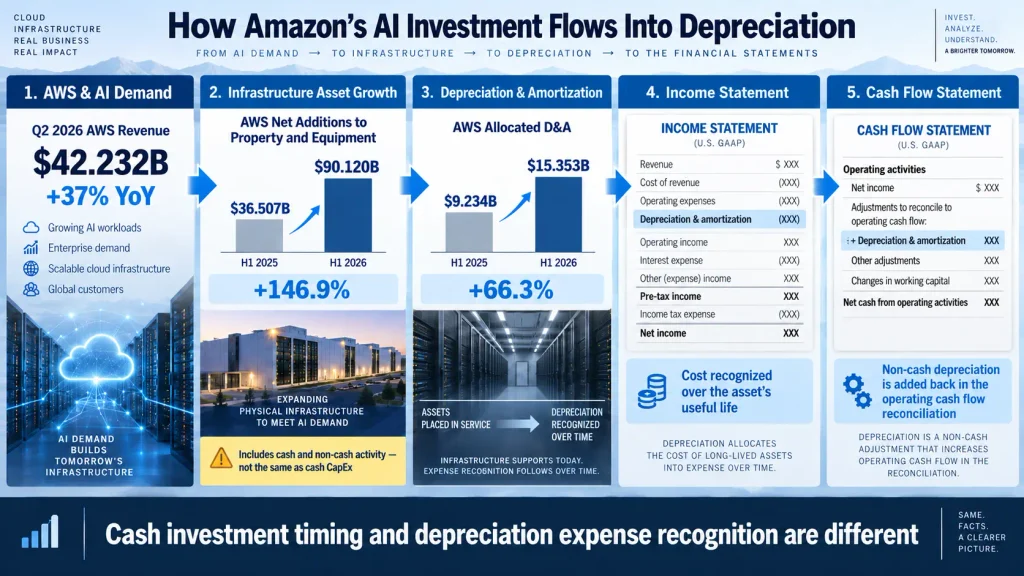
AWS net additions to property and equipment rose from $36.507 billion in H1 2025 to $90.120 billion in H1 2026, while allocated depreciation and amortization increased to $15.353 billion. Net additions include non-cash activity, so they should not be treated as identical to cash CapEx.
Why Higher CapEx Leads to Higher Depreciation Later
Capital spending and depreciation affect the financial statements at different times. When Amazon buys servers or builds data-center infrastructure, the cash outlay occurs when the asset is paid for. The accounting expense, however, is generally recognized over the asset’s useful life rather than entirely on the purchase date.
That is why a rapid infrastructure expansion can create two effects at once: heavy current cash spending and rising future depreciation expense.
AWS allocated depreciation and amortization on property and equipment increased from $9.234 billion in the first half of 2025 to $15.353 billion in the first half of 2026, or about 66.3%. The increase reflects a much larger asset base being placed into service and used to support customer workloads.
This distinction matters for investors because depreciation reduces reported operating profit without creating an equivalent cash payment in the same period. The cash effect occurs when Amazon pays for the asset or makes financing payments; depreciation later allocates the asset’s cost across the periods in which it is used.
Why Depreciation Is Added Back in Operating Cash Flow
Amazon uses the indirect method for its cash-flow statement. The calculation begins with net income and then adjusts for non-cash items and changes in operating assets and liabilities.
Depreciation is one of those non-cash adjustments. It reduces accounting earnings, but it does not represent a new cash outflow during the period in which the depreciation expense is recorded. For that reason, depreciation and amortization are added back when reconciling net income to operating cash flow.
Amazon’s consolidated depreciation and amortization adjustment—which includes property and equipment, capitalized content costs, operating-lease assets, and other items—increased from $29.489 billion to $38.933 billion for the first six months of 2026 versus the comparable 2025 period. On a trailing-twelve-month basis, the adjustment increased from $58.562 billion to $75.200 billion.
Those figures are broader than the AWS-specific $15.353 billion depreciation and amortization figure. They should not be treated as interchangeable. One represents a consolidated cash-flow-statement adjustment across multiple asset categories; the other is the portion of property-and-equipment depreciation and amortization allocated to AWS.
Q2 2026 also illustrates why cash-flow reconciliation matters for Amazon specifically. The company reported $53.4 billion of non-operating pre-tax other income in the quarter, primarily related to its Anthropic investments. The cash-flow statement adjusts for non-operating and non-cash effects rather than allowing accounting gains to be mistaken for operating cash generation.
Why Free Cash Flow Turned Negative Even as OCF Rose
Amazon defines free cash flow as operating cash flow reduced by purchases of property and equipment, net of proceeds from sales and incentives. Amazon classifies FCF as a non-GAAP financial measure and notes that it should be viewed alongside the full cash-flow statement.
Free Cash Flow = Operating Cash Flow − Purchases of Property and Equipment, net of proceeds from sales and incentives
For the twelve months ended June 30, 2025:
$121.137B − $102.953B = $18.184B of FCF
For the twelve months ended June 30, 2026:
$161.403B − $169.007B = -$7.604B of FCF
The contrast is significant. Operating cash flow increased by about $40.266 billion, but net cash spending on property and equipment increased by roughly $66.054 billion. Amazon itself said the decline in TTM FCF was driven primarily by a $66.1 billion year-over-year increase in those net property-and-equipment purchases, and that the increase primarily reflected AI investment.
| TTM Metric | June 2025 | June 2026 | Change |
|---|---|---|---|
| Operating cash flow | $121.137B | $161.403B | +33.2% |
| Net cash PP&E spending | $102.953B | $169.007B | +64.2% |
| Free cash flow | +$18.184B | -$7.604B | -$25.788B |
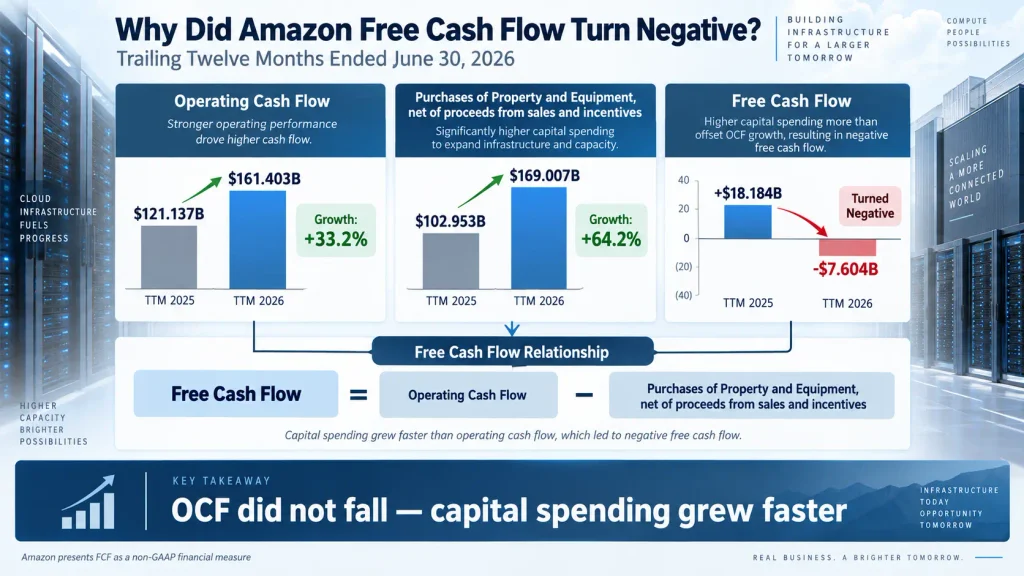
For the trailing twelve months ended June 30, 2026, Amazon’s operating cash flow increased 33.2%, while net cash spending on property and equipment increased about 64.2%. Amazon-reported FCF consequently moved from +$18.184 billion to -$7.604 billion.
The Question Is Not Whether CapEx Is High, but What It Earns
Negative free cash flow does not, by itself, prove that Amazon’s AI investments are working or failing. It shows that current cash infrastructure spending is consuming more cash than operating activities produced under Amazon’s FCF definition.
The economic test comes later. Investors need to compare the capital committed today with the revenue, operating profit, and operating cash flow generated by the expanded infrastructure over time.
AWS provides clear evidence of strong current revenue growth. Q2 2026 AWS sales rose about 37%, and AWS operating income increased to approximately $16.6 billion from $10.2 billion a year earlier. At the same time, the asset base and depreciation burden are expanding quickly.
That creates a useful monitoring sequence for future earnings reports:
- AWS revenue growth: Is demand still growing fast enough to absorb additional capacity?
- Operating cash flow: Is cash generation keeping pace with the scale of the business?
- Cash infrastructure spending: Is the growth rate of CapEx beginning to moderate?
- Depreciation: How quickly is the larger asset base flowing through the income statement?
- Free cash flow: Is operating cash growth eventually catching up with the investment cycle?
This is also why comparing Amazon with another hyperscaler can be useful. Smart Asset Desk’s Microsoft free cash flow analysis examines a similar dynamic: operating cash flow rose sharply while AI infrastructure investment grew even faster.
How This Fits Into a Broader Cash-Flow Analysis
Free cash flow is useful because it forces investors to look beyond accounting earnings, but it is not a complete measure of business quality. Amazon explicitly notes that its FCF measure omits other cash-flow items and does not represent all cash available for discretionary spending.
If the OCF-minus-CapEx mechanics are unfamiliar, the Smart Asset Desk free cash flow guide explains how operating cash flow and capital expenditures connect. For investors focused on the market’s reaction to Amazon’s recent results, the separate Amazon stock drop analysis looks at earnings, AI spending, and valuation from a stock-price perspective rather than an accounting-mechanics perspective.
The dedicated CapEx view adds a different layer. Amazon’s 2026 cash-flow profile is not simply a story of weakening cash generation. The company is generating more operating cash while simultaneously committing even more cash to infrastructure. The long-term outcome will depend on whether AWS and AI monetization produce enough incremental cash returns to justify that investment intensity.
Frequently Asked Questions
Why is Amazon free cash flow negative if operating cash flow increased?
Operating cash flow increased to $161.403 billion for the trailing twelve months ended June 30, 2026, but net cash spending on property and equipment rose even faster to $169.007 billion. Under Amazon’s FCF definition, that produced a $7.604 billion outflow.
Is Amazon’s $90.120 billion of AWS net PP&E additions the same as cash CapEx?
No. Amazon states that net additions to property and equipment include non-cash activity such as equipment acquired but not yet paid and finance-lease additions. The $90.120 billion figure is useful for measuring the expansion of AWS’s asset base, but it should not be treated as identical to cash capital spending.
Does negative free cash flow mean Amazon’s AI strategy is failing?
No conclusion that strong can be drawn from one FCF period. The current data show rising operating cash flow, rapid AWS growth, and an even larger increase in infrastructure spending. The more important question is whether future AWS and AI revenue, operating income, and operating cash flow generate adequate returns on the assets being built today.
This article is for educational and investment-research purposes only and is not a recommendation to buy or sell Amazon or any other security. Financial data reflect the reporting periods stated above and may change in future filings. Investors should review primary-source filings and consider their own objectives and risk tolerance before making investment decisions.