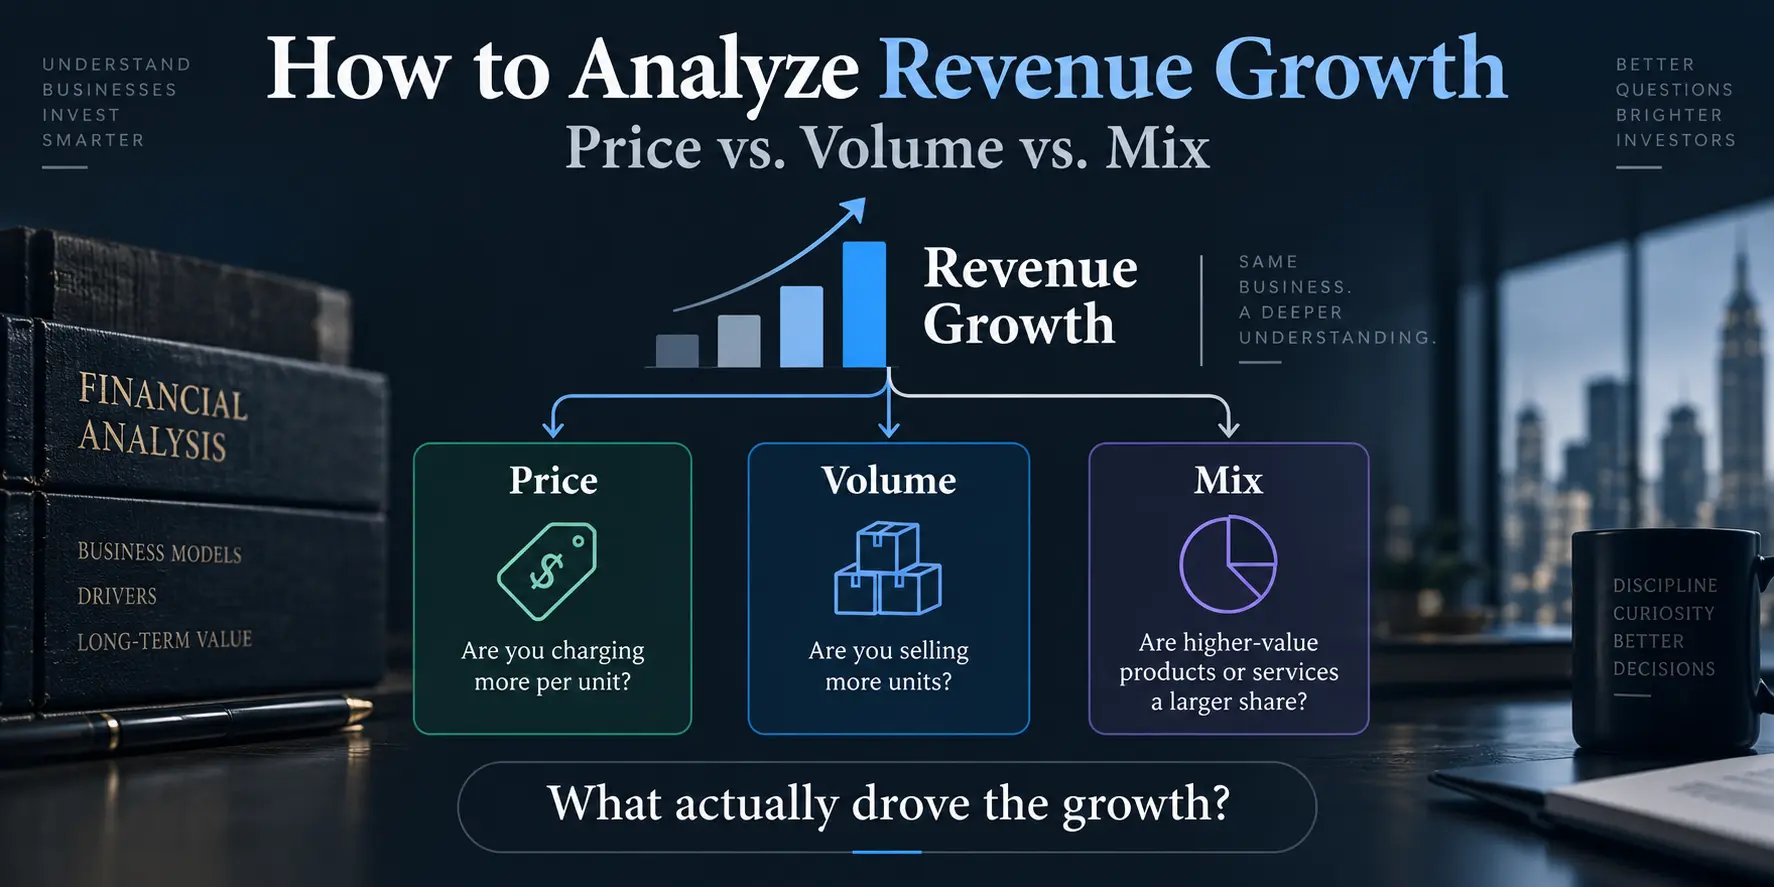
How to analyze revenue growth is one of the most important questions in fundamental analysis because the headline growth rate rarely tells the whole story. A company can grow sales by raising prices, selling more units, shifting customers toward higher-priced products, benefiting from currency movements, or acquiring another business.
That means investors should look beyond “How fast did sales grow?” and ask a more useful question: “What actually caused the growth?”
Revenue growth is the outcome. Price, volume, and mix help explain how the company got there. The quality of that growth becomes clearer only when those drivers are connected to margins, cash generation, and returns on invested capital.
How to Analyze Revenue Growth Using Price, Volume, and Mix
The first step in learning how to analyze revenue growth is understanding the basic calculation:
Revenue Growth = (Current-Period Revenue − Prior-Period Revenue) ÷ Prior-Period Revenue × 100
If revenue rises from $100 million to $110 million, the growth rate is 10%.
($110 million − $100 million) ÷ $100 million × 100 = 10%
The math is simple. The interpretation is not.
A 10% increase could come almost entirely from higher selling prices while unit sales decline. Another company could generate the same 10% growth with stable pricing and significantly higher unit volume. A third could sell the same number of units but shift customers toward premium products.
| Metric | What It Measures | What Investors Should Ask |
|---|---|---|
| Revenue Growth | Change in total reported sales | How fast is the top line growing? |
| Price | Impact of changes in selling prices | Does the business have pricing power? |
| Volume | Change in units sold or business activity | Is underlying demand expanding? |
| Mix | Changes in product, channel, package, or geography | Is the company shifting toward more valuable sales? |
| Gross Margin | Gross profit relative to revenue | Is growth translating into better unit economics? |
| ROIC | Operating return generated on invested capital | How efficiently is capital supporting the growth? |
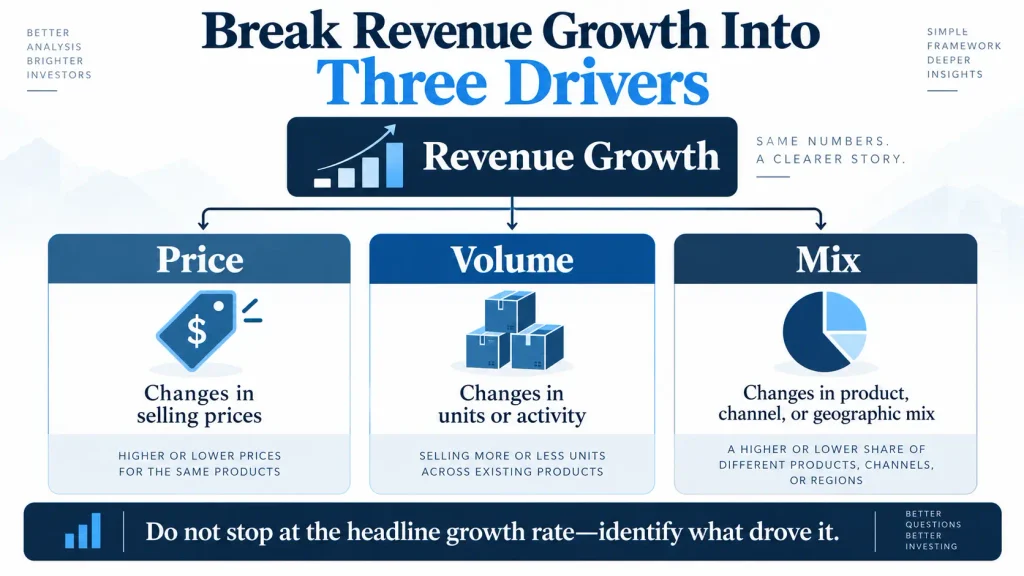
This framework separates headline revenue growth into pricing, volume, and mix. Companies may define these drivers differently, so investors should always check the definitions in the company’s earnings release or regulatory filing.
Price: Is the Company Growing by Charging More?
Pricing is often one of the most revealing components of top-line growth. When input costs, wages, or distribution expenses rise, a company may increase selling prices to protect profitability.
If a company can raise prices without a meaningful deterioration in volume, that may be evidence of pricing power. Strong brands, switching costs, differentiated products, or limited competition can all contribute to that ability.
The opposite situation requires more investigation. A company may raise prices enough to keep reported revenue growing even while unit volume falls. That does not automatically mean the underlying business is weakening, because volume can also be affected by promotions, supply constraints, product transitions, or changes in customer mix.
Persistent price increases accompanied by sustained volume declines, however, should prompt investors to examine elasticity, customer behavior, and market-share trends rather than celebrating the headline revenue number by itself.
Volume: Is the Business Actually Selling More?
Volume measures the change in physical units, shipments, transactions, subscribers, or another activity measure appropriate to the business.
When volume rises without a large increase in price, it can point to stronger customer demand, market expansion, new customer acquisition, or market-share gains. In many businesses, this is an important sign that growth is not being produced solely by inflation or price increases.
Volume growth is not automatically high-quality growth, however. Heavy discounting can increase unit sales while reducing gross margin. Aggressive promotions may also pull future demand into the current period without creating a durable improvement in the economics of the business.
That is why volume should be analyzed alongside both pricing and profitability.
Mix: The Often-Overlooked Revenue Driver
Mix captures changes in what a company sells and where it sells it. Even if total unit volume is unchanged, revenue can rise when customers buy more premium products, larger packages, higher-value services, or products sold through more favorable channels.
Geographic mix can matter as well. A company generating a larger share of sales in higher-priced markets can report a positive mix effect even without a broad-based price increase.
This distinction matters when management reports a combined Price/Mix figure. Investors should not automatically interpret a 5% Price/Mix contribution as a 5% increase in product prices.
The Coca-Cola Company, for example, defines price/mix as including pricing actions as well as changes in categories, products, packages, channels, and geographic territories. The metric is therefore broader than pure pricing. Investors can review the definition directly in Coca-Cola’s 2025 Form 10-K.
Once these three drivers are separated, how to analyze revenue growth becomes much clearer: start with the reported growth rate, determine what came from price, volume, and mix, and then ask whether those drivers improved the underlying economics of the business.
Coca-Cola: Why 2% Revenue Growth Does Not Mean 2% Volume Growth
Coca-Cola provides a useful real-world example of why headline sales growth and underlying operating drivers need to be separated.
For fiscal 2025, the company reported $47.941 billion in net operating revenues, up from $47.061 billion in 2024. That was a reported increase of 2%.
Coca-Cola’s 2025 Form 10-K revenue bridge attributed a 1% positive contribution to volume, a 4% positive contribution to Price/Mix, a 2% negative foreign-currency effect, and a 1% negative effect from acquisitions and divestitures. Importantly, the filing also states that worldwide concentrate sales volume increased 1% while unit case volume was unchanged from 2024. The 1% revenue-bridge volume contribution therefore should not be read as 1% growth in consumer-level unit case volume.
| Coca-Cola FY2025 Revenue Driver | Impact vs. 2024 | Interpretation |
|---|---|---|
| Volume | +1% | Revenue contribution primarily tied to concentrate sales volume; unit case volume was flat for the year |
| Price/Mix | +4% | Pricing and sales-mix effects supported revenue |
| Foreign Currency | -2% | Currency translation reduced reported growth |
| Acquisitions & Divestitures | -1% | Structural changes reduced reported growth |
| Reported Revenue Growth | +2% | Net result of the combined drivers |
The takeaway is not that pricing-driven growth is inherently better or worse than volume growth. It is that the reported 2% increase alone would hide most of the underlying story. Price and mix provided a larger positive contribution, while currency and structural changes offset part of that benefit. The distinction between concentrate sales volume and unit case volume also shows why company-specific definitions matter.
P&G: Reported Sales Growth Can Differ From Organic Demand
Procter & Gamble offers another useful example because its earnings materials break sales growth into volume, foreign exchange, price, mix, and other factors.
For fiscal 2026, P&G reported $87.0 billion in net sales, up 3% from the prior year. The company attributed two percentage points of growth to favorable foreign exchange and one percentage point to higher pricing. Total-company volume and mix were unchanged. Organic sales, which exclude foreign-exchange effects and acquisitions and divestitures, increased 1%.
An investor looking only at the 3% reported sales increase could therefore overstate the underlying increase in business activity. Unit volume did not rise at the total-company level during the fiscal year, while favorable foreign exchange accounted for two percentage points of reported growth.
The segment data adds another layer. P&G’s Beauty segment reported 7% net sales growth for FY2026, with volume contributing 4%, foreign exchange 2%, pricing 1%, and mix unchanged. In other words, the composition of growth differed substantially between Beauty and the company as a whole.
The figures are available in P&G’s official FY2026 earnings release.
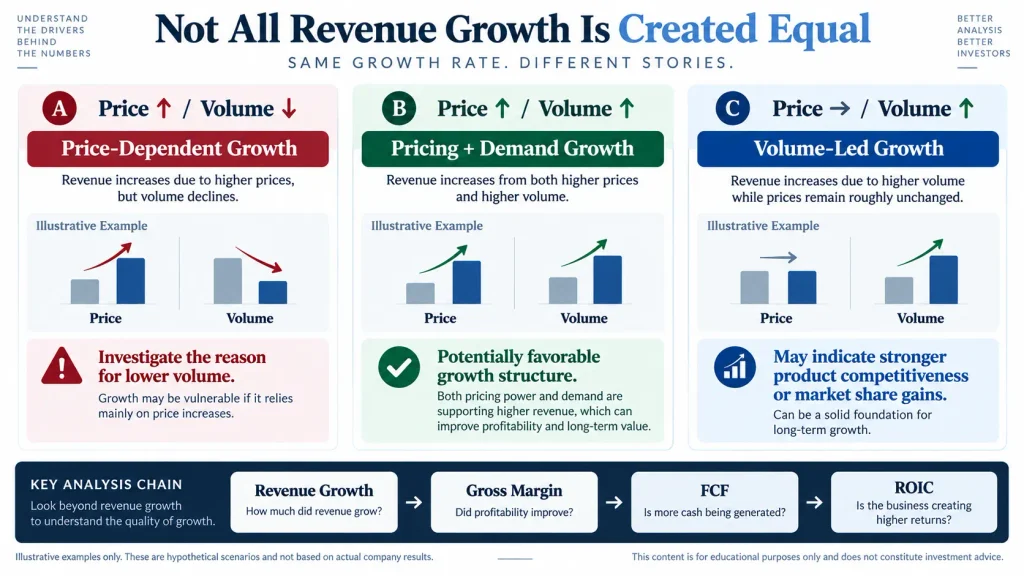
These hypothetical scenarios show why the same headline revenue growth rate can reflect very different business conditions. The examples are illustrative, not actual company results; margins, cash flow, and capital efficiency still need to be evaluated.
Revenue Growth Quality Depends on What Happens Next
Separating price, volume, and mix is useful, but it is only the first layer of analysis. A company can produce impressive revenue growth while creating little incremental economic value.
A more complete sequence is:
Revenue Growth → Price / Volume / Mix → Gross Margin → Free Cash Flow → ROIC
1. Check Whether Gross Margin Confirms the Growth Story
If a company raises prices, maintains volume, and improves gross margin, the combination can provide stronger evidence that pricing is offsetting cost pressure without severely damaging demand.
By contrast, rapid revenue and volume growth paired with a falling gross margin may indicate discounting, unfavorable product mix, higher input costs, or an expensive customer-acquisition strategy.
2. Follow Accounting Growth Into Cash Flow
Revenue ultimately needs to produce cash. Rising sales accompanied by weak operating cash flow can signal working-capital pressure, rising receivables, inventory buildup, or heavy reinvestment requirements.
Our Free Cash Flow Guide explains how to move from accounting earnings to operating cash flow and capital expenditures when evaluating how much cash a business actually retains after investment.
3. Ask How Much Capital Was Required to Produce the Growth
Consider two companies that each increase revenue by 10%. One uses its existing brand, distribution network, and production capacity. The other requires major new factories, inventory, and working capital to achieve the same top-line increase.
Their revenue growth rates are identical, but their economics may be very different.
Return on invested capital helps connect operating profit to the capital required to produce it. For a deeper look at that distinction, see our ROE vs. ROIC analysis.
Four Revenue Growth Traps Investors Should Watch
Inflation-driven pricing. Nominal revenue can increase simply because a company charges more during an inflationary period. That does not necessarily mean underlying demand is growing at the same rate.
Foreign-exchange effects. Multinational companies translate overseas sales back into U.S. dollars. Currency movements can therefore boost or reduce reported revenue even when local-market operating performance changes very little.
Acquisitions and divestitures. Acquiring another business can add revenue immediately without demonstrating organic growth in the existing business. When available, organic sales growth can help separate those effects.
Mix shifts. Flat unit volume is not automatically negative. A shift toward premium products or higher-value channels can increase revenue and potentially improve profitability even when total units sold are unchanged.
How to Analyze Revenue Growth: A Practical Checklist
Start with the reported growth rate. Compare revenue with the same period a year earlier and determine whether the comparison is quarterly, annual, or trailing.
Find the operating driver. Look for volume, units, shipments, subscribers, transactions, comparable sales, or another industry-specific activity measure.
Separate pricing from mix when possible. If management combines them, read the company’s definition before treating the figure as pure price inflation.
Adjust your interpretation for currency and M&A. Reported growth and organic growth can tell different stories.
Check gross margin. Determine whether the growth is improving or weakening unit economics.
Follow the result into cash flow. Compare operating cash flow and free cash flow with the direction of revenue.
Finish with capital efficiency. Ask how much additional capital was required to generate the growth and whether returns on that capital remain attractive.
Visa provides a useful industry-specific example of this process. In Visa Operating Leverage: What FY2026 Results Really Show, processed transactions, payments volume, cross-border activity, client incentives, and expense growth are used to connect top-line drivers with operating leverage instead of treating revenue growth as a single headline number.
The Bottom Line
Understanding how to analyze revenue growth requires more than checking whether sales increased or decreased. The same headline percentage can come from stronger demand, higher prices, favorable mix, currency translation, or acquisitions.
The most useful analysis therefore starts with the top line and then works downward: identify the Price–Volume–Mix drivers, check whether gross margin confirms the economics, follow the result into free cash flow, and finally evaluate how efficiently the company used capital to generate the growth.
That process does not tell investors whether a stock will rise or fall. It does something more useful: it helps distinguish growth in reported sales from growth in the underlying economic value of the business.
Frequently Asked Questions
How Do You Analyze Revenue Growth in an Earnings Report?
To understand how to analyze revenue growth in an earnings report, start with the reported year-over-year growth rate and then look for price, volume, mix, foreign-exchange, and acquisition effects. Next, compare those drivers with gross margin, free cash flow, and ROIC to determine whether higher sales are translating into stronger business economics.
Is High Revenue Growth Always a Positive Sign?
No. Revenue can increase because of higher prices, acquisitions, currency movements, or aggressive discounting as well as stronger underlying demand. Investors should examine the drivers of growth and then compare them with margins, cash flow, and capital requirements.
Is Volume Growth Better Than Price-Driven Growth?
Neither is automatically superior. Higher volume can indicate stronger demand, but it can also be created through discounts that hurt profitability. Pricing growth can demonstrate pricing power, but repeated price increases accompanied by persistent volume declines warrant closer examination. The interaction between price, volume, and margins matters more than any one driver in isolation.
Investment Disclaimer
This article is provided for educational and informational purposes only and does not constitute investment advice, a recommendation, or a solicitation to buy or sell any security. Company data reflects the reporting periods identified in the article and may change in subsequent filings. Investors should conduct their own research and consider their individual financial circumstances before making investment decisions.