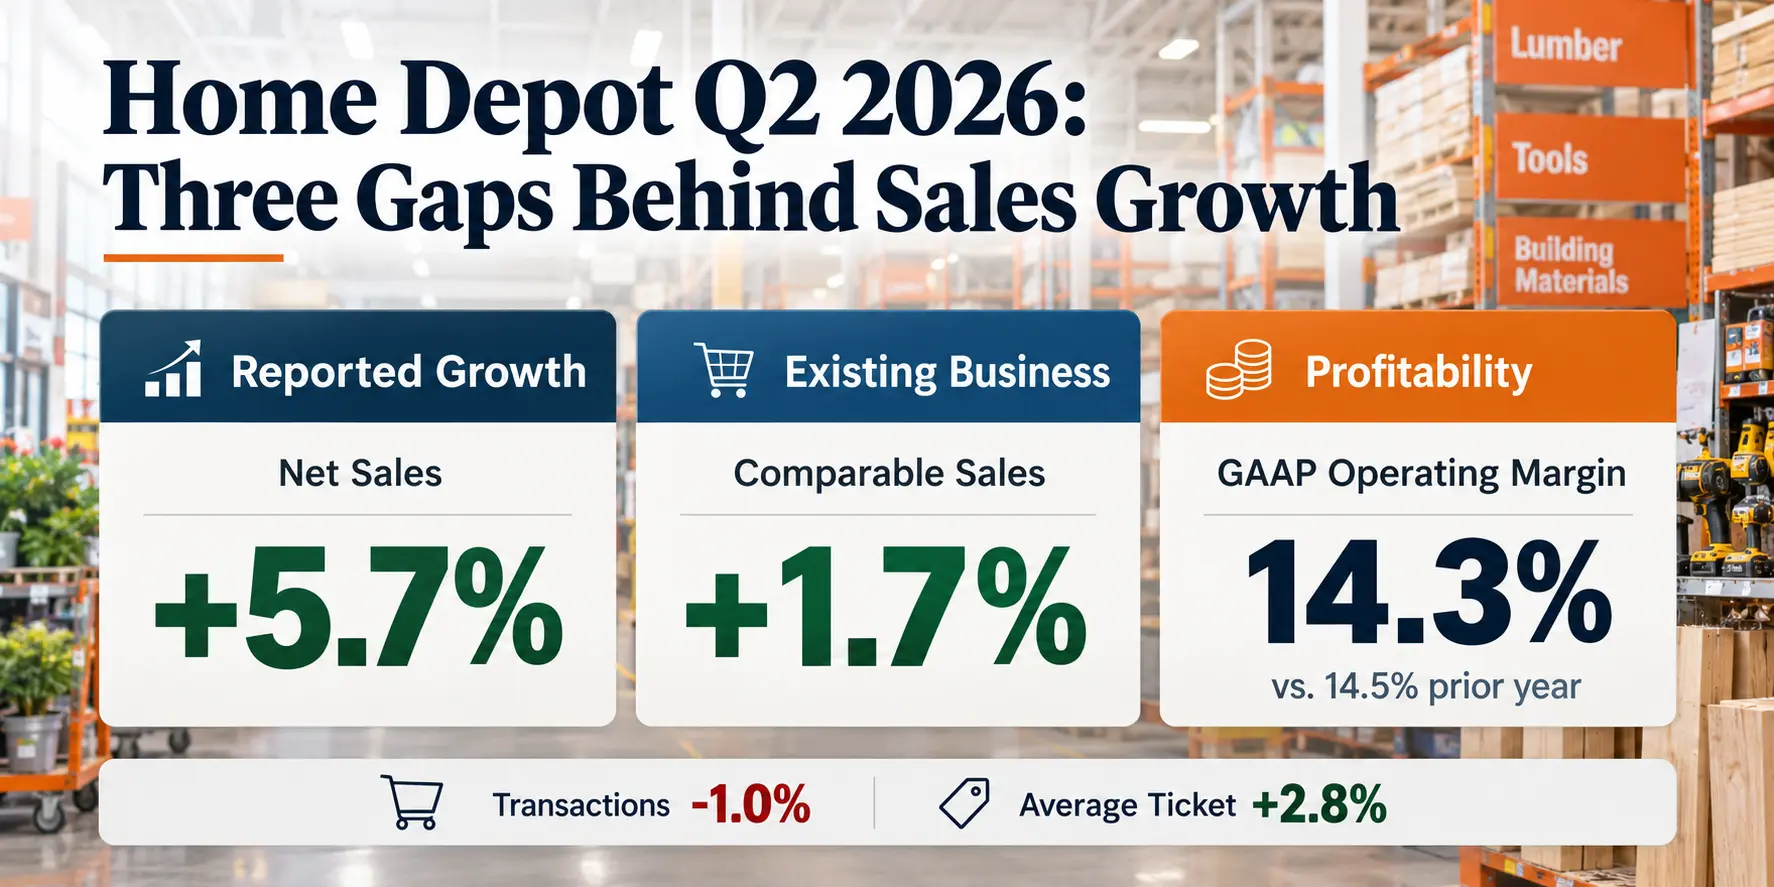
Home Depot Q2 2026 earnings look straightforward at first glance: net sales rose 5.7% to $47.861 billion. But the headline growth rate tells only part of the story. The quarter becomes more informative when the numbers are separated into three different questions: how much of the growth came from expansion and acquisitions, what happened inside the comparable business, and whether the higher sales translated into stronger operating profitability.
Home Depot’s Q2 2026 results show three different growth signals at once. Net sales increased 5.7%, comparable sales increased 1.7%, and comparable customer transactions declined 1.0% while comparable average ticket increased 2.8%. Reported gross margin improved, but operating margin declined. Investors therefore need to separate company expansion, customer behavior and margin quality rather than treating 5.7% as one unified growth rate.
What Home Depot Q2 2026 earnings reveal beyond headline sales growth
For the quarter ended August 2, 2026, Home Depot reported net sales of $47.861 billion, up from $45.277 billion a year earlier. Comparable sales increased 1.7%, while comparable sales in the United States increased 1.3%.
Those figures answer different questions. Net sales measure the size of the consolidated company. Comparable sales are designed to provide a clearer view of established locations and digital operations that meet Home Depot’s comparability criteria.
| Investor Question | FY2026 Q2 Evidence | What It Helps Measure |
|---|---|---|
| How fast did the consolidated company grow? | Net Sales +5.7% | Total scale, including acquisitions and new locations |
| How did the established business perform? | Comparable Sales +1.7% | Growth across comparable locations and websites |
| Did comparable customer activity increase? | Comparable Transactions -1.0% | Change in transaction activity within the comparable base |
| Did spending per transaction increase? | Comparable Average Ticket +2.8% | Change in average dollars per comparable transaction |
| Did profitability improve with sales? | Gross Margin 33.7%; Operating Margin 14.3% | Whether top-line growth carried through the income statement |
These figures come from Home Depot’s fiscal Q2 2026 earnings release and its Form 10-Q for the quarter ended August 2, 2026.
For a broader explanation of why these metrics differ, the Smart Asset Desk guide to comparable sales in retail analysis explains how same-store performance can diverge from consolidated revenue growth.
Gap 1: GMS explains a large part of the difference between 5.7% sales growth and 1.7% comps
The first gap is between reported sales growth and the performance of the comparable business.
Home Depot generated $2.584 billion more net sales than in the prior-year quarter. The company said GMS, acquired on September 4, 2025, contributed approximately $1.4 billion of incremental sales during fiscal Q2 2026.
That means GMS alone accounted for roughly 54% of the quarter’s total year-over-year dollar increase in net sales:
GMS share of Home Depot’s Q2 sales increase
Total sales increase: $47.861B – $45.277B = $2.584B
GMS incremental sales: approximately $1.4B
$1.4B ÷ $2.584B ≈ 54%
Another way to frame the scale is to divide the $1.4 billion contribution by the prior-year quarterly sales base of $45.277 billion. On that basis, the GMS contribution is equivalent to roughly 3.1 percentage points of the prior-year sales base. This is a derived analytical ratio, not a growth contribution percentage reported by Home Depot.
The remaining sales increase reflected a combination of positive comparable sales, the Mingledorff’s acquisition, new stores and branches, foreign exchange and other factors. A weaker U.S. dollar added approximately $105 million to fiscal Q2 net sales.
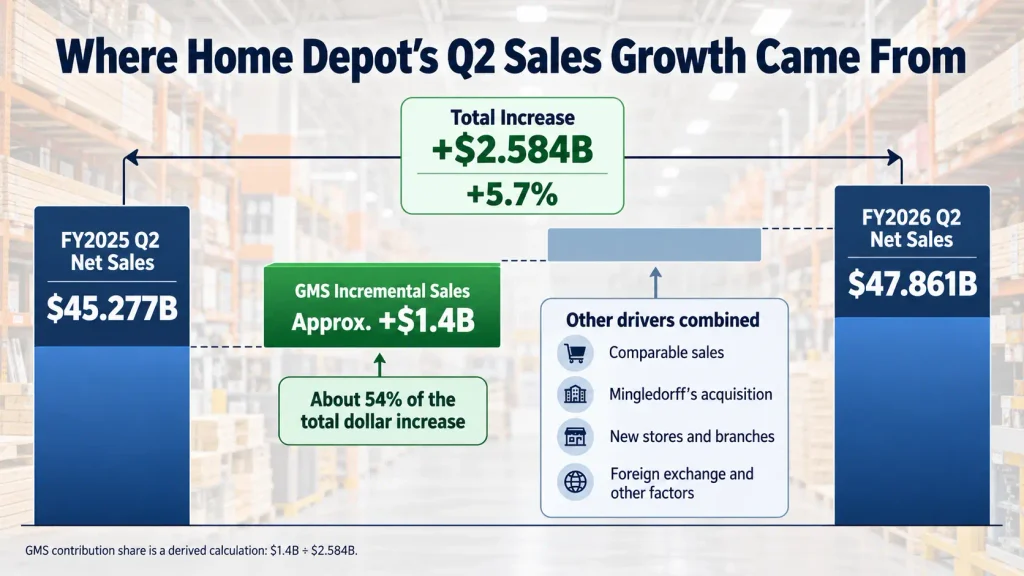
Home Depot’s net sales increased by $2.584 billion year over year. GMS contributed about $1.4 billion of incremental sales, equal to roughly 54% of the total dollar increase; the remaining growth came from comparable sales, other acquisitions, new locations and other factors.
This distinction is especially important because Home Depot generally includes acquired businesses in comparable sales only after they have been owned for more than 52 weeks. GMS had not yet crossed that threshold during the quarter ended August 2, 2026.
For investors, the takeaway is not that acquisition-driven growth is inherently weaker. Acquisitions can create substantial value. The point is that a 5.7% increase in consolidated sales and a 1.7% increase in comparable sales describe different layers of the business.
Gap 2: Average ticket carried more of the comparable-sales growth than transactions
The second gap appears inside the 1.7% comparable-sales increase.
Comparable customer transactions declined 1.0%, while comparable average ticket increased 2.8%. Home Depot also reported an average ticket of $92.50, up from $90.01 in the prior-year quarter.
A simple multiplicative check shows why positive comparable sales can coexist with fewer transactions:
Comparable transactions: -1.0% → 0.990
Comparable average ticket: +2.8% → 1.028
0.990 × 1.028 = 1.01772
That implies an approximate increase of 1.8%, close to the reported 1.7% comparable-sales growth.
This is a reasonableness check rather than Home Depot’s official comparable-sales formula. The reported percentages are rounded, and the scope of the operating metrics is not identical in every respect. Home Depot specifically states that its customer-transactions and average-ticket measures exclude HD Supply and SRS.
The ticket increase should also not be interpreted as a 2.8% across-the-board price increase. Average ticket can change because of selling prices, the number of items purchased per transaction, product mix, project type and the relative contribution of higher-priced products.
Home Depot said the quarter reflected customer engagement with smaller repair and maintenance projects despite consumer uncertainty and housing-affordability pressure. That context makes the transaction trend worth monitoring. Positive ticket growth can support sales for a period, but persistent transaction weakness would raise a different question than growth supported by both ticket and customer activity.
The broader framework is similar to the one in How to Analyze Revenue Growth: Price vs. Volume vs. Mix: investors need to identify what actually produced the higher top line before interpreting the quality of that growth.
Gap 3: Gross margin improved while operating margin moved the other way
The third gap sits farther down the income statement.
Gross profit increased 6.5% to $16.115 billion from $15.125 billion. Gross margin was approximately 33.7%, compared with about 33.4% in the prior-year quarter. Management described the year-over-year improvement as approximately 25 basis points.
That improvement, however, needs an important qualification.
During the quarter, Home Depot received IEEPA tariff refunds. Management said $685 million reduced cost of goods sold for products that had already been sold. On the earnings call, the company estimated that this refund provided approximately 145 basis points of gross-margin benefit.
That benefit was partly offset by approximately 60 basis points of higher fuel, energy and other product-input costs and approximately 60 basis points of mix pressure associated with the GMS and Mingledorff’s acquisitions. The resulting bridge was approximately a 25-basis-point year-over-year gross-margin increase.
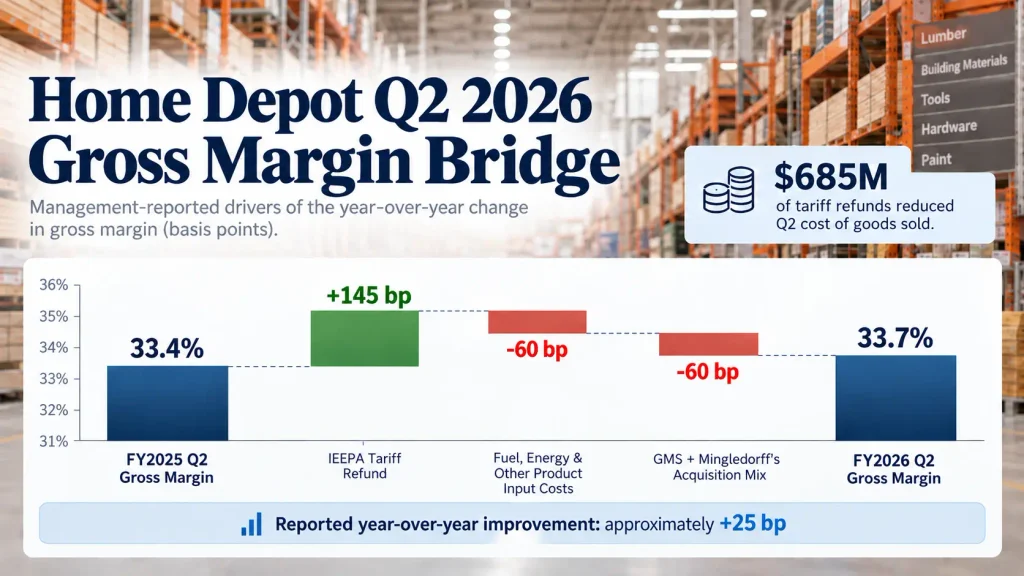
Management said the $685 million IEEPA tariff refund added about 145 basis points to Q2 gross margin. Roughly 60 basis points of higher input costs and 60 basis points of acquisition mix pressure offset most of that benefit, leaving reported gross margin about 25 basis points higher year over year.
This margin bridge is useful because the reported 33.7% gross margin by itself could suggest a cleaner improvement in underlying merchandise economics than the quarter actually contained. The refund was a large positive item, while input costs and acquisition mix moved in the opposite direction.
The official discussion is available in Home Depot’s fiscal Q2 2026 earnings-call transcript.
Operating profitability did not improve alongside gross margin. Operating income increased 4.3% to $6.839 billion, slower than the 5.7% increase in sales. GAAP operating margin declined to 14.3% from 14.5%.
SG&A increased 8.5% to $8.424 billion, while total operating expenses increased 8.2% to $9.276 billion. Management also said operating expenses rose to 19.4% of sales, approximately 45 basis points higher than in the prior-year quarter.
That combination produces a more nuanced profitability picture: gross margin moved higher, but operating expenses absorbed enough of the benefit that operating margin still moved lower.
The Smart Asset Desk guide to gross margin analysis explains why investors should identify the driver of a margin change before treating the direction alone as evidence of stronger business economics.
A better reading of Home Depot Q2: separate scale, demand and margin quality
Home Depot’s fiscal Q2 2026 results become easier to interpret when the quarter is divided into four layers rather than summarized by a single growth rate.
| Layer | Q2 Signal | What Investors Still Need to Know |
|---|---|---|
| Scale | Net Sales +5.7% | How much future growth comes from acquisitions versus the existing base? |
| Underlying Demand | Comparable Sales +1.7% | Can comparable transactions stabilize or return to growth? |
| Customer Behavior | Transactions -1.0%; Ticket +2.8% | Is ticket growth coming from price, mix, project size or another factor? |
| Margin Quality | Gross Margin +25 bp; Operating Margin -20 bp | What remains after temporary benefits and operating-cost pressure? |
This framework avoids treating acquisitions as if they were same-store demand, or treating a higher average ticket as if it automatically meant stronger customer traffic. It also prevents a temporary or timing-related gross-margin benefit from being mistaken for a broad improvement across the entire cost structure.
What would change the interpretation next quarter?
The first metric worth watching is comparable customer transactions. A quarter in which ticket growth continues to offset declining transactions tells a different demand story from one in which both metrics turn positive.
The second is the source of average-ticket growth. If management provides evidence that pricing, project mix or larger baskets are driving the change, investors can better judge whether the increase is likely to persist.
The third is the relationship between acquisition growth and the comparable base. Home Depot states that acquisitions are typically added to comparable sales after more than 52 weeks of ownership. As acquired operations mature into the comparable-sales calculation, today’s distinction between acquired growth and comparable growth can change.
Finally, the margin bridge deserves continued attention. Home Depot reaffirmed fiscal 2026 guidance for gross margin of approximately 33.1% and GAAP operating margin of approximately 12.4% to 12.6%. Management said the IEEPA tariff refunds are expected to partially offset unplanned fuel, energy and other product-input costs throughout fiscal 2026.
For that reason, the next earnings report should be evaluated less by whether gross margin is simply above or below the second-quarter figure and more by what drove the movement.
Frequently Asked Questions
Was Home Depot’s 5.7% Q2 sales growth mainly comparable-store growth?
No. Comparable sales increased 1.7%, while consolidated net sales increased 5.7%. Home Depot said GMS contributed approximately $1.4 billion of incremental Q2 sales. That was roughly 54% of the total year-over-year dollar increase in net sales, based on a simple comparison with the $2.584 billion total increase.
Can comparable sales rise when customer transactions fall?
Yes. Comparable customer transactions declined 1.0% in fiscal Q2 2026, but comparable average ticket increased 2.8%. A higher amount spent per transaction can offset fewer transactions and still produce positive comparable-sales growth.
Did Home Depot’s higher Q2 gross margin mean profitability improved across the business?
Not across every level of the income statement. Gross margin rose to about 33.7%, helped materially by the IEEPA tariff refund, but GAAP operating margin declined to 14.3% from 14.5%. Operating expenses grew faster than sales, so the gross-margin improvement did not fully carry through to operating profitability.
Investment Disclaimer
This article is provided for informational and educational purposes only and does not constitute financial advice or a recommendation to buy or sell any security. Financial data reflects the reporting period and sources identified in the article and may change in later periods. Investors are responsible for their own research, investment decisions and resulting gains or losses.