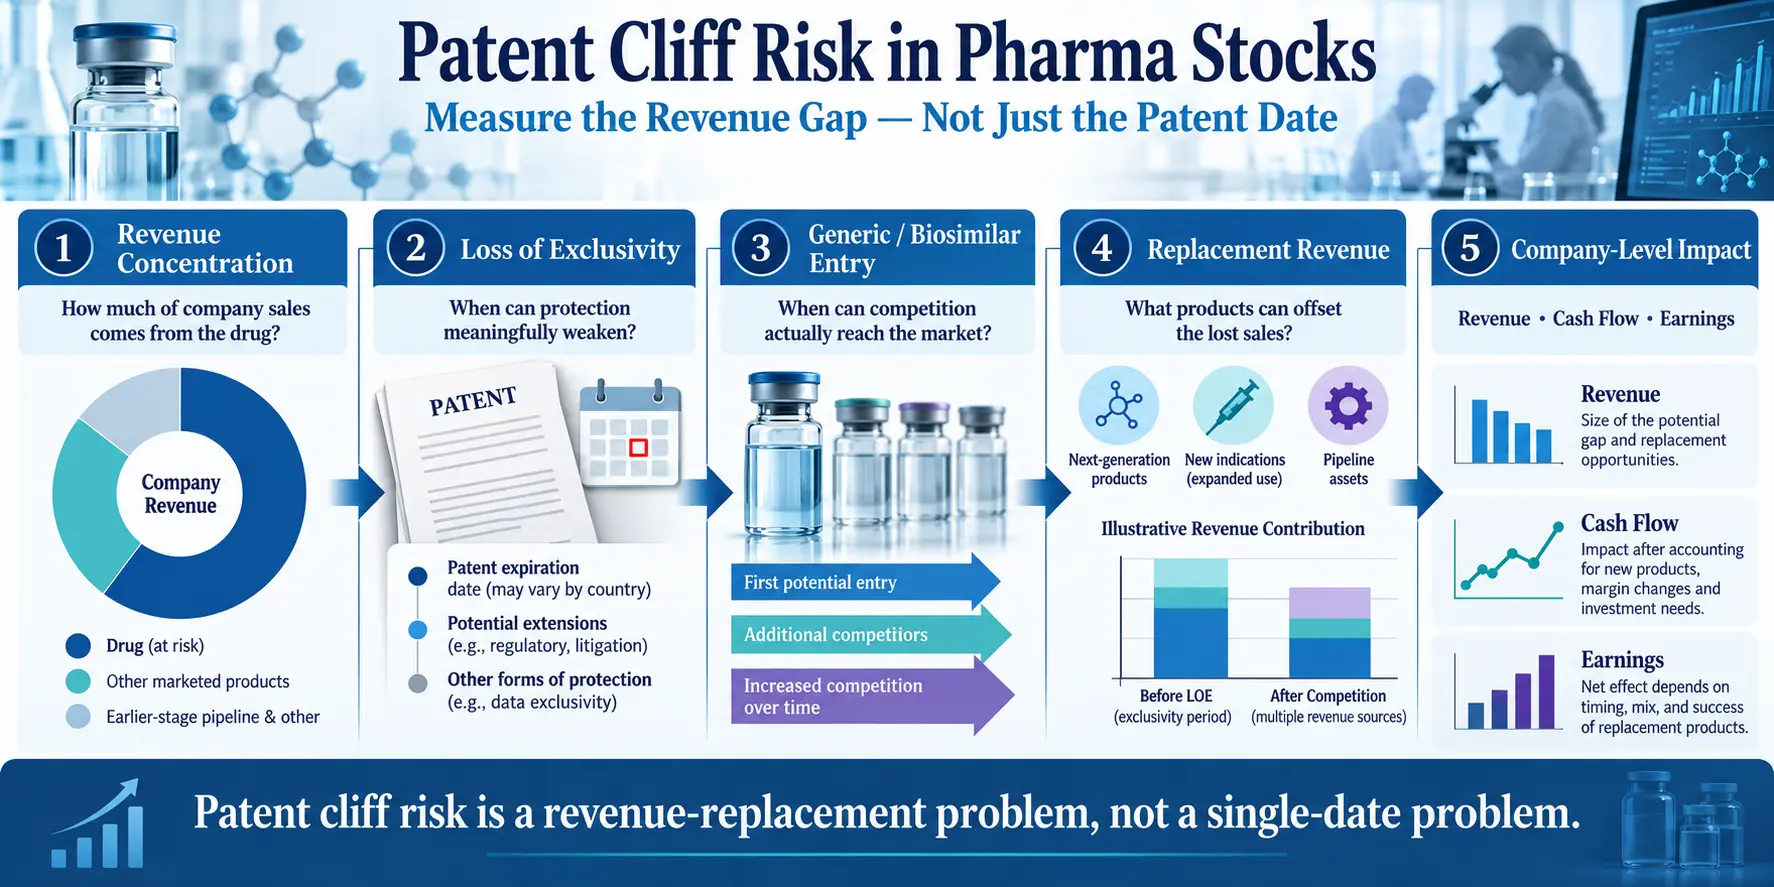
Patent cliff risk is best analyzed as a revenue-replacement problem, not as a single patent-expiration date. For a pharmaceutical investor, the useful questions are how much revenue is concentrated in the protected product, when meaningful generic or biosimilar competition can actually begin, how quickly that revenue may erode, and whether other products can fill the gap before the decline reaches the companywide financial statements.
Two real-world cases show why this distinction matters. Humira entered U.S. biosimilar competition in 2023 after generating more than one-third of AbbVie’s annual revenue. Keytruda, meanwhile, represented nearly half of Merck’s 2025 sales, while Merck expects biosimilar competition to have a material sales impact between 2028 and 2029.
Those figures do not mean the two drugs will follow the same path. Humira gives investors an observed post-loss-of-exclusivity case. Keytruda is a forward-looking concentration case. Putting them side by side helps separate what has already happened from what investors still need to monitor.
Patent cliff risk starts with revenue concentration
The first useful calculation is not a patent date. It is the percentage of company revenue generated by the product that will eventually face competition.
Product Revenue Concentration = Product Revenue ÷ Total Company Revenue × 100
This is not a standardized GAAP metric. It is a simple analytical tool for estimating how much of the company’s current revenue base is tied to one product franchise.
| Case | Product Revenue | Company Revenue | Revenue Concentration | What Investors Can Observe |
|---|---|---|---|---|
| Humira / AbbVie FY2022 | $21.237B | $58.054B | 36.6% | An observed loss-of-exclusivity case followed by biosimilar erosion |
| Keytruda / Merck FY2025 | $31.680B | $65.011B | 48.7% | A forward-looking concentration risk ahead of expected biosimilar pressure |
The comparison is useful, but it is not a forecast that Keytruda will repeat Humira’s sales trajectory. The products, indications, competitive markets, patent estates, formulations, and future replacement portfolios differ. Revenue concentration tells investors the size of the exposure today. It does not tell them the eventual erosion rate.
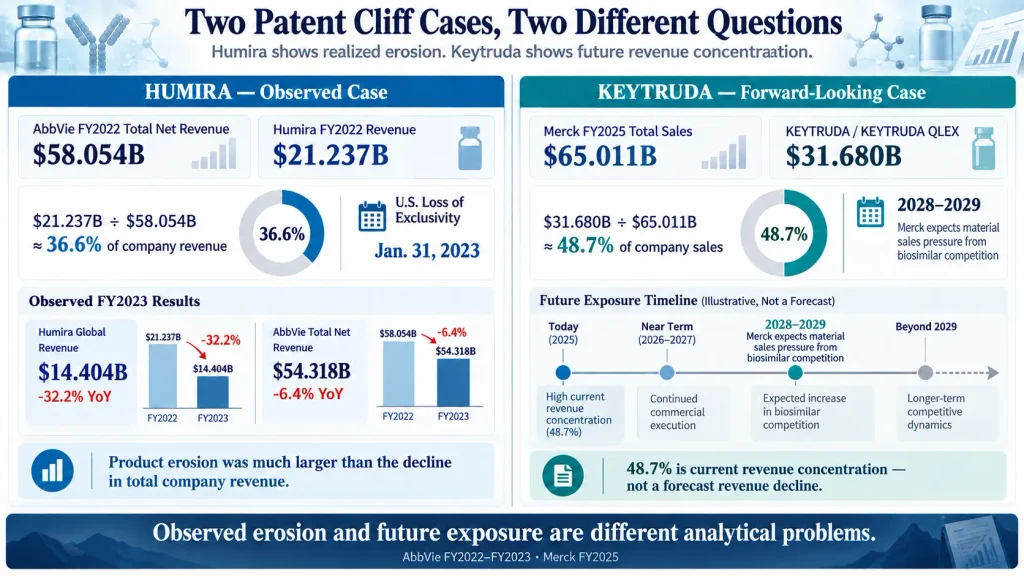
Humira provides an observed post-LOE example, while Keytruda is a forward-looking concentration case. The comparison uses company-reported annual sales and does not imply that Keytruda will experience the same erosion rate as Humira.
Humira shows why product erosion and company damage are not the same number
AbbVie’s Humira is a useful historical case because investors can compare the product decline with the company’s overall revenue decline after U.S. loss of exclusivity.
According to AbbVie’s 2022 Form 10-K, Humira generated $21.237 billion of global net revenue in 2022 while AbbVie generated $58.054 billion of total net revenue.
The concentration calculation is:
$21.237B ÷ $58.054B × 100 ≈ 36.6%
AbbVie described Humira as approximately 37% of total net revenue for the year. The filing also states that Humira lost exclusivity in the United States on January 31, 2023 and that the company expected direct biosimilar competition to reduce U.S. Humira revenue.
The decline arrived quickly at the product level. AbbVie’s 2023 Form 10-K shows global Humira revenue of $14.404 billion, down 32.2% from 2022. U.S. Humira revenue fell 34.7%.
AbbVie’s total company net revenue, however, declined from $58.054 billion to $54.318 billion, a 6.4% decrease.
| AbbVie FY2022–FY2023 | FY2022 | FY2023 | YoY Change |
|---|---|---|---|
| Global Humira Revenue | $21.237B | $14.404B | -32.2% |
| AbbVie Total Net Revenue | $58.054B | $54.318B | -6.4% |
The gap between those two percentages is one of the most useful lessons from a patent cliff. A 32.2% decline in a major drug franchise did not produce a 32.2% decline in companywide revenue. Other products and business lines absorbed part of the lost revenue.
That does not make the product erosion unimportant. It changes the analytical question. Instead of stopping at the product decline, investors need to determine how much of the lost revenue is being replaced elsewhere in the portfolio.
Keytruda shows why concentration matters years before the cliff
Merck’s Keytruda illustrates the other side of the analysis: assessing a large revenue exposure before the most significant expected biosimilar pressure arrives.
Merck reported $65.011 billion of total sales in 2025. Keytruda and Keytruda Qlex generated $31.680 billion combined, according to Merck’s 2025 Form 10-K.
The resulting concentration is:
$31.680B ÷ $65.011B × 100 ≈ 48.7%
Merck describes Keytruda revenue as approximately 49% of total company sales for 2025. That level of concentration explains why investors may spend years following the company’s replacement products, new indications, formulations, licensing deals, and pipeline progress before the primary U.S. patent event arrives.
Merck expects Keytruda sales to be materially negatively affected by biosimilar competition between 2028 and 2029. The company states that biosimilar competition could begin in December 2028 when the primary compound patent expires. It also identifies two patents in the Keytruda composition-of-matter patent family that expire in May and November 2029 and expects those patents to be subject to litigation.
Those disclosures are more useful than treating “2028” as a single automatic cliff date. Competition can depend on litigation, regulatory pathways, individual patents, market launches, formulations, and geography.
Most importantly, the 48.7% figure is not an estimate that Merck will lose 48.7% of its revenue. It measures current sales concentration. The future company-level outcome will depend on both Keytruda erosion and the sales produced by the rest of Merck’s portfolio at that time.
A patent expiration date is not the same as competitive entry
U.S. investors often use “patent expiration” and “loss of exclusivity” as shorthand for the same event, but the underlying legal and commercial timeline can be more complicated.
The FDA explains that patents and regulatory exclusivity are distinct. Patents are property rights granted by the U.S. Patent and Trademark Office, while FDA exclusivity is a statutory protection associated with drug approval. Patent protection and exclusivity may overlap, but they do not have to expire at the same time.
A single product can also be covered by multiple patents. Litigation may affect when a competing product launches, and a competitor that receives regulatory approval does not necessarily enter the market on the same day that one patent expires.
Biologic drugs add another layer because competition usually comes from biosimilars rather than conventional small-molecule generics. The FDA’s biosimilar guidance describes a biosimilar as a biological product that is highly similar to an FDA-approved reference product without clinically meaningful differences in safety or effectiveness.
For investors, the practical lesson is straightforward: the commercial competition window matters more than one isolated patent date.
Build a patent cliff screen from five questions
A useful review can be organized around five questions that move from product exposure to company-level financial impact.
- How concentrated is revenue? Calculate the product’s share of company sales using the same reporting period for the numerator and denominator.
- What is the realistic loss-of-exclusivity window? Read the company’s patent disclosures, regulatory-exclusivity information, and litigation discussion rather than relying on one search-result date.
- When can real competition begin? Separate regulatory approval from commercial launch and distinguish conventional generics from biosimilars.
- What can replace the lost revenue? Focus on products already producing sales or close enough to commercialization to matter during the erosion period.
- How much of the erosion reaches the financial statements? Follow the effect through total revenue, margins, operating cash flow, and free cash flow.
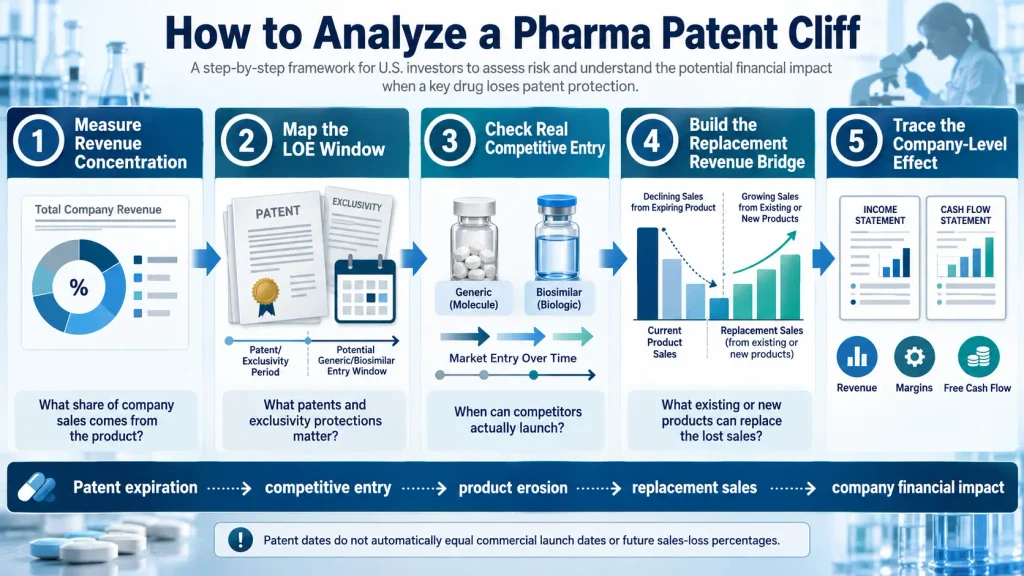
A patent-cliff review moves from product concentration to the realistic competition window, replacement sales, and finally company-level financial impact. Each step answers a different question, so one patent expiration date is not enough.
A replacement-revenue bridge can make the risk easier to quantify
One way to think about a patent cliff is to separate gross product erosion from the revenue that other products may add. This is not a GAAP metric and should not be treated as a company forecast. It is simply a scenario tool for understanding the size of the possible gap.
Consider a hypothetical drug producing $10 billion of annual revenue. An investor might test a scenario in which competitive erosion eventually removes 50% of that revenue, creating $5 billion of revenue at risk. If other products are assumed to add $3 billion over the same period, the remaining uncovered gap would be $2 billion.
| Illustrative Scenario | Amount | Interpretation |
|---|---|---|
| Current product revenue | $10B | Starting revenue base |
| Assumed erosion | 50% | Scenario assumption, not a forecast |
| Revenue at risk | $5B | Potential lost product revenue under the assumption |
| Replacement revenue | $3B | Illustrative sales added elsewhere |
| Uncovered revenue gap | $2B | Amount not offset in the scenario |
This approach forces two assumptions into the open: how much of the old franchise might erode and how much replacement revenue could realistically arrive. Both estimates can be wrong, which is why a range of scenarios is more informative than one precise-looking forecast.
It also prevents a common analytical mistake. A large pipeline is not automatically equivalent to large replacement revenue. Early-stage clinical assets, newly approved products, and established multibillion-dollar franchises should not be treated as if they have the same probability or timing.
Where to find patent cliff evidence in a 10-K
Product-level revenue is usually the best place to begin. Find the major product table and calculate how much of consolidated revenue comes from the franchise being analyzed.
Next, review sections such as Business, Patents, Trademarks and Licenses, Intellectual Property, and Risk Factors. The exact headings vary by company, but these sections often describe major patent expirations, loss-of-exclusivity expectations, litigation, and the anticipated effect of generic or biosimilar competition.
Then compare those disclosures with the most recent product-sales commentary. A company may discuss the same risk using phrases such as “loss of exclusivity,” “biosimilar competition,” or “generic competition” without using the phrase “patent cliff.”
FDA resources can provide additional context. The Orange Book is relevant for approved small-molecule drugs, while the Purple Book provides information related to licensed biological products. Neither should be reduced to one date without considering the company’s own disclosures about litigation and expected competitive timing.
Connect patent erosion to revenue quality and cash flow
The companywide revenue number becomes more informative after the product-level analysis. If a major franchise is declining but consolidated sales remain stable, determine what created the offset. New product launches, higher volume in other franchises, acquisitions, pricing, foreign exchange, and product mix can all affect the headline number.
Our guide to analyzing revenue growth explains how to move beyond the reported growth rate and identify the drivers underneath it. That same discipline is useful after a patent cliff because consolidated growth can hide large changes between mature and replacement products.
The next step is cash generation. Developing new drugs, acquiring pipeline assets, expanding manufacturing capacity, and supporting launches can require substantial cash before replacement revenue reaches full scale.
The Smart Asset Desk free cash flow guide provides the next layer of analysis: whether accounting revenue and earnings are translating into operating cash flow after investment needs.
For a pharmaceutical company, the full path is therefore broader than patent expiration alone:
Revenue Concentration → Loss of Exclusivity → Competitive Entry → Product Erosion → Replacement Revenue → Company Revenue → Cash Flow
Frequently Asked Questions
Does a patent cliff mean a drug’s revenue goes to zero?
No. A patent cliff describes increased revenue pressure after protection weakens and competing products enter the market. The speed and size of erosion can vary by product, market, payer behavior, pricing, competitive launches, and geography. Humira’s 2023 results show substantial erosion, but the product still generated $14.404 billion of global revenue that year.
Why can biosimilar competition begin at a different time from a patent date?
A drug can be covered by multiple patents and separate regulatory protections, while patent litigation can affect launch timing. Approval of a competing product and commercial entry are also separate events. Investors should therefore use company filings and FDA information together rather than treating one patent-expiration date as a guaranteed launch date.
What makes a company better positioned for a patent cliff?
No single metric answers that question. Useful evidence includes lower dependence on the expiring franchise, replacement products already generating meaningful sales, multiple sources of growth, a credible commercialization timeline, and sufficient cash generation to fund R&D, launches, licensing, or acquisitions without creating excessive financial strain.
The bottom line: measure the revenue gap, not just the date
A patent date tells investors when one layer of protection may change. It does not tell them how much company revenue is exposed, when competitors will actually reach the market, how quickly the product will erode, or how much replacement revenue will be available.
Humira demonstrates the difference between a severe product-level decline and a smaller companywide revenue decline. Keytruda demonstrates why concentration deserves attention several years before the expected biosimilar window.
The most practical approach is to quantify the current product exposure, map the realistic competition period, test reasonable erosion scenarios, and compare the possible lost revenue with sales that other products could generate.
For pharma investors, the patent cliff is not one date on a calendar. It is the period in which a company must replace a protected revenue stream before the erosion materially changes the economics of the business.
This article is for educational and investment-research purposes only and is not a recommendation to buy or sell any security. Financial data reflects the stated reporting periods and may change in later filings. Investors are responsible for their own investment decisions and outcomes.