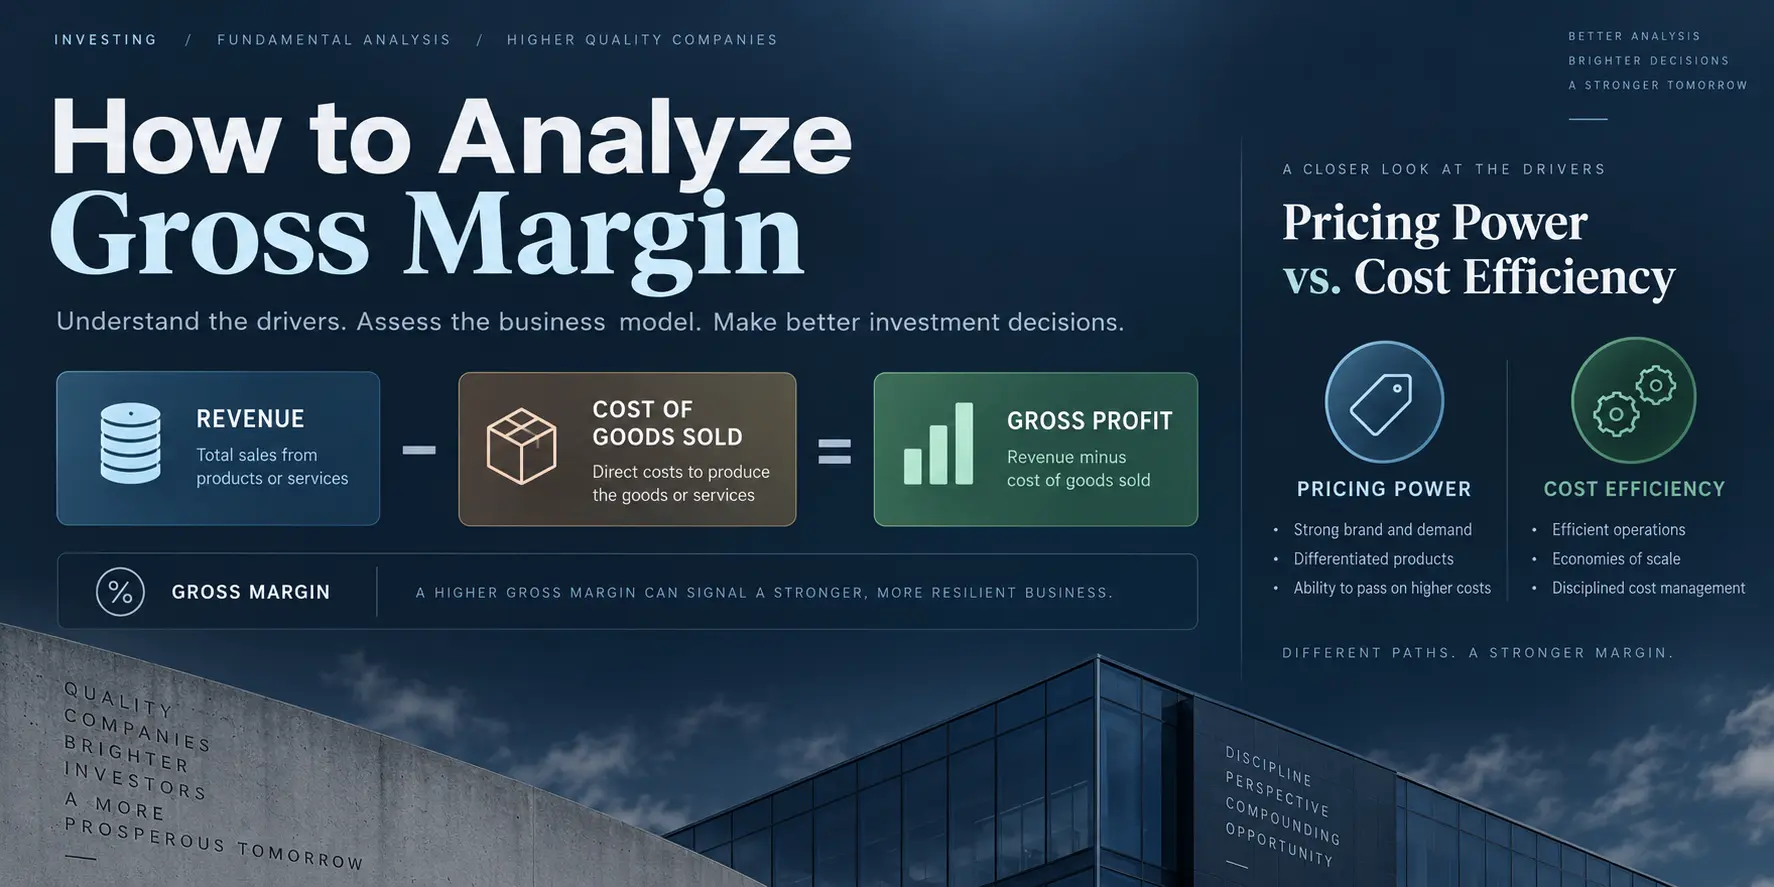
Learning how to analyze gross margin helps investors understand whether improving profitability comes from pricing power, lower production costs, or a better product mix. Revenue growth often gets the headline during earnings season, but higher sales do not automatically mean that a business is becoming more profitable.
Gross margin can reveal useful information about pricing power, production costs, product mix, and operating efficiency. A rising margin may reflect a stronger competitive position, but it can also result from temporary input-cost relief. A falling margin can signal pressure, yet it may also reflect a deliberate shift toward lower-margin products or markets.
For investors, the key question is not simply whether gross margin increased or decreased. The better question is why it changed and whether the driver appears sustainable.
What Gross Margin Actually Tells Investors
Gross margin measures how much revenue remains after subtracting the direct costs associated with producing the goods or services a company sells.
Gross Margin = (Revenue − Cost of Goods Sold) ÷ Revenue × 100
If a company generates $100 in revenue and incurs $40 of direct production costs, gross profit is $60 and gross margin is 60%.
That does not mean the company keeps $60 as net income. Research and development, sales and marketing, corporate overhead, interest, taxes, and other expenses still have to be deducted. Gross margin is better understood as an early measure of the economics of the product or service itself.
| What to Check | What It May Indicate |
|---|---|
| Gross margin rising | Pricing, product mix, or production economics may be improving |
| Gross margin falling | Pricing pressure, higher input costs, or weaker mix may be weighing on profitability |
| Year-over-year trend | Helps separate a one-quarter fluctuation from a broader change |
| Peer comparison | Adds industry context because normal gross margins vary widely by business model |
| Related metrics | Volume, operating margin, free cash flow, and ROIC help complete the analysis |
The Same Gross Margin Increase Can Mean Very Different Things
Two companies can report the same increase in gross margin while experiencing very different changes in their underlying economics. That distinction matters because not every source of margin expansion has the same durability or competitive significance.
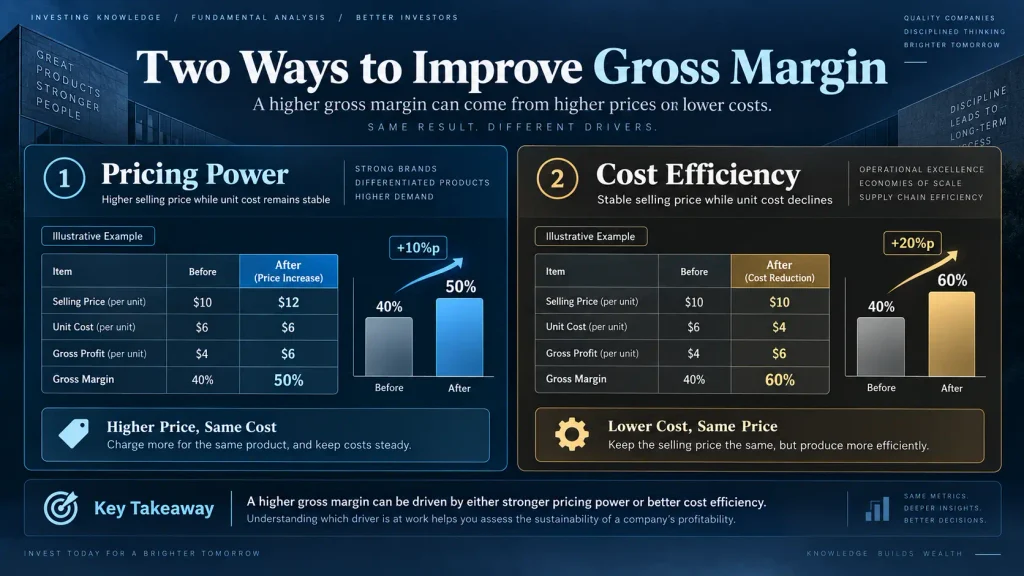
Illustrative example: A higher gross margin can result either from stronger pricing power or lower production costs. The figures shown in this visual are hypothetical and are not actual results from any company. Identical margin improvement can imply very different business economics depending on whether price, cost, volume, or product mix drove the change.
Pricing power: customers accept a higher selling price
Suppose a company raises the price of a product from $100 to $105 while its direct unit cost stays at $60. Gross profit per unit rises from $40 to $45.
The price increase becomes much more informative if unit volume remains relatively stable. Customers continuing to buy after a price increase may indicate brand strength, product differentiation, intellectual property, switching costs, or another competitive advantage.
But pricing should not be analyzed by itself. If volume falls sharply or market share deteriorates, a higher gross margin may be masking weakening demand.
Cost efficiency: the company spends less to produce the same sale
Gross margin can also expand without a meaningful change in selling prices. Lower raw-material costs, improved supply chains, automation, higher factory utilization, or productivity gains can reduce the cost required to generate each dollar of revenue.
The important distinction is whether the cost improvement is temporary or company-specific. A broad decline in commodity prices may benefit an entire industry for several quarters. By contrast, sustained productivity gains or manufacturing improvements may represent a more durable advantage.
Separate Price, Volume, Cost, and Product Mix
When gross margin changes, it helps to break the movement into four broad variables instead of treating the reported percentage as a standalone signal.
- Price: Did the company raise or lower selling prices?
- Volume: Did customers continue buying after those price changes?
- Cost: Did materials, labor, manufacturing, or logistics become more or less expensive?
- Product mix: Did higher-margin products account for a larger share of sales?
Product mix is especially easy to overlook. A company can report strong revenue growth while gross margin declines if lower-margin products are driving most of that growth. The reverse can also happen: modest sales growth combined with a richer mix of higher-margin products can improve overall profitability.
This is why gross margin analysis should move beyond the formula. The percentage identifies the direction of change; price, volume, cost, and mix help explain the cause.
Johnson & Johnson Q2 2026: A Real Gross Margin Example
Johnson & Johnson offers a useful recent case study. According to the company’s second-quarter 2026 results, reported sales reached $25.310 billion, compared with $23.743 billion in the prior-year quarter.
GAAP cost of products sold increased to $8.051 billion from $7.628 billion. Gross profit therefore rose to $17.259 billion from $16.115 billion.
| Johnson & Johnson | Q2 2026 | Q2 2025 | YoY Change |
|---|---|---|---|
| Revenue | $25.310B | $23.743B | +6.6% |
| Cost of Products Sold | $8.051B | $7.628B | +5.5% |
| Gross Profit | $17.259B | $16.115B | +7.1% |
| Gross Margin | 68.2% | 67.9% | +0.3 percentage points |
The relationship among those figures matters more than the 68.2% margin by itself. Revenue increased 6.6% year over year while cost of products sold rose 5.5%. Gross profit consequently grew 7.1%, faster than revenue, and gross margin improved from 67.9% to 68.2%.

Johnson & Johnson Q2 2026 GAAP results: revenue increased to $25.310 billion from $23.743 billion, while cost of products sold rose to $8.051 billion from $7.628 billion. Gross profit increased to $17.259 billion, lifting gross margin from 67.9% to 68.2%, an improvement of 0.3 percentage points.
That is a positive margin movement, but a 0.3-percentage-point increase does not by itself prove that Johnson & Johnson suddenly gained significantly more pricing power. Investors still need to examine pricing, volume, currency effects, segment mix, and underlying cost trends before assigning a specific cause to the improvement.
The company’s Q2 2026 Form 10-Q provides the underlying GAAP income-statement figures and additional segment disclosures that can help with that next step.
Why Financial Statements and Management Commentary Should Be Read Together
An income statement shows what changed, but it does not always explain precisely why the change occurred.
Earnings releases, SEC filings, and earnings-call commentary can provide the missing context. Depending on the company, useful terms to look for include pricing, volume, product mix, raw-material costs, labor, freight, currency, tariffs, and manufacturing efficiency.
For example, margin expansion driven by temporary freight relief deserves a different interpretation from margin expansion caused by customers consistently accepting higher prices. The reported percentage may look similar, but the implications for future earnings can be very different.
Why a High Gross Margin Does Not Automatically Mean a Great Business
Gross margins vary substantially across industries. A software company may have relatively low incremental costs for serving additional customers, while a manufacturer or retailer can incur significant material, production, or merchandise costs on every sale.
Comparing gross margins across unrelated industries can therefore be misleading. The more useful comparisons are often the company’s own historical trend and the margins of businesses with similar economics.
Gross margin also sits relatively high on the income statement. A company can produce an attractive gross margin and still generate weak operating profit or free cash flow if research, marketing, administrative, or other operating expenses consume most of its gross profit.
For a deeper look at the next stage of profitability analysis, the Free Cash Flow Guide explains how operating cash flow and capital expenditures determine how much cash remains after the business funds its ongoing investment needs.
A practical progression for fundamental analysis is:
Revenue Growth → Gross Margin → Operating Margin → Free Cash Flow → ROIC
Each step answers a different question. Revenue shows whether the business is expanding. Gross margin provides information about the economics of what it sells. Operating margin incorporates the cost of running the broader organization. Free cash flow tests whether accounting profits translate into cash, while ROIC helps assess how efficiently the company uses invested capital.
To extend that analysis from profitability into capital efficiency, the ROE vs ROIC capital efficiency guide explains why a high accounting return on equity can look different from the return generated by the operating capital actually employed in the business.
A Practical Gross Margin Checklist for Earnings Season
- Compare the trend. Review several quarters and year-over-year periods instead of reacting to one isolated percentage.
- Separate price from volume. Higher prices are more informative when customer demand remains healthy.
- Identify the cost driver. Determine whether lower costs came from temporary market conditions or company-specific efficiency gains.
- Check product mix. A shift toward higher- or lower-margin products can materially change the consolidated figure.
- Compare appropriate peers. Gross margin is most useful when the underlying business models are reasonably similar.
- Move down the income statement. Confirm that gross-profit strength eventually supports operating income and cash generation.
Bottom Line
Learning how to analyze gross margin is less about memorizing what qualifies as a “good” percentage and more about understanding the business economics behind the movement.
A rising gross margin can be encouraging when it reflects sustainable pricing power, a better product mix, or durable efficiency gains. But the same increase deserves more caution when it comes mainly from temporary commodity or freight relief. Likewise, a declining margin does not automatically mean that a business is deteriorating if the company is intentionally entering a different product category or investing in a growth initiative with different economics.
The most useful approach is to treat gross margin as an investigative starting point. Once the direction is clear, examine price, volume, cost, and mix, and then determine whether the improvement or deterioration carries through to operating profit and free cash flow.
Frequently Asked Questions
What is a good gross margin?
There is no universal gross-margin percentage that defines a good company. Normal levels vary significantly by industry and business model. Historical trends and comparisons with economically similar competitors are usually more informative than a single absolute threshold.
Does a rising gross margin always mean a company has pricing power?
No. Gross margin can rise because of higher prices, lower input costs, better manufacturing efficiency, or a shift toward higher-margin products. Pricing power is more convincing when prices rise without a significant deterioration in unit volume or market share.
What should investors analyze after gross margin?
Operating margin is a logical next step because it incorporates broader operating expenses. Free cash flow can then show how much cash the business generates after its operating and capital needs, while ROIC can help evaluate how efficiently that capital is being used.
Investment Disclaimer
This article is for educational and research purposes only and does not constitute investment advice or a recommendation to buy or sell any security. Financial data may change after the stated reporting period. Investors should conduct their own research and consider their individual objectives and risk tolerance before making investment decisions.