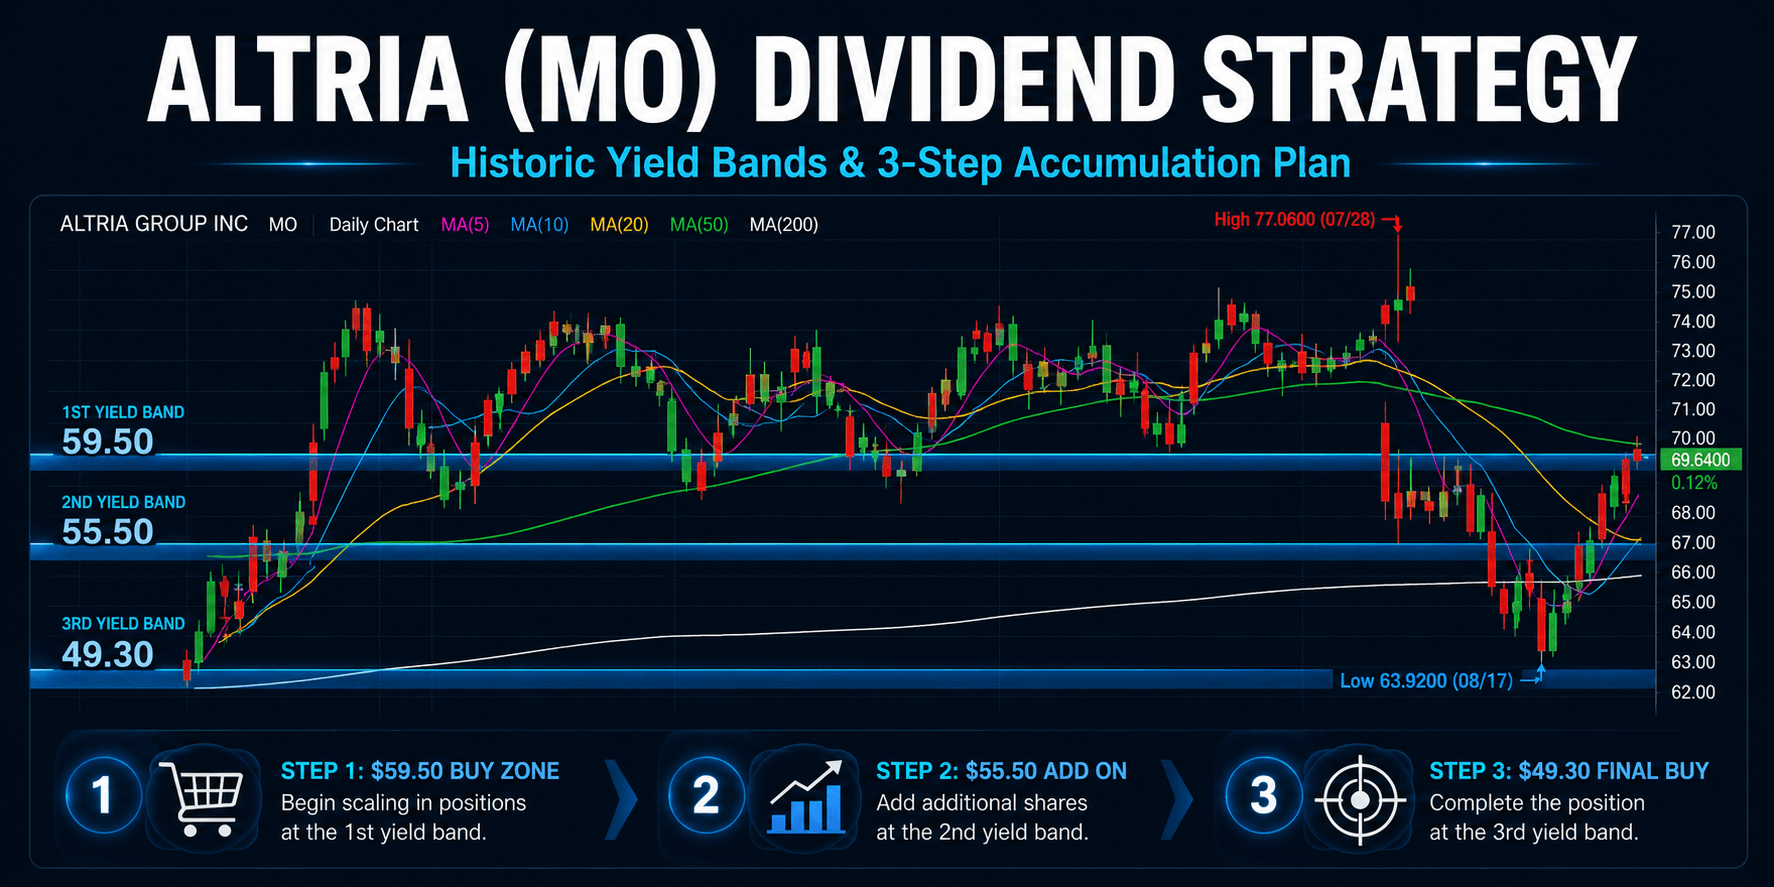
The current Altria dividend yield stands at approximately 6.4% following the company’s recent 4.7% quarterly dividend increase to an annualized 4.44 dollars per share. While this yield appears generous on an absolute basis, disciplined investors must recognize that the stock is currently trading above its multi-year valuation baseline. Consequently, establishing clear entry levels based on historical yield percentiles is critical for long-term income sustainability.
Institutional Investment Takeaway: High-yield investing requires a strict assessment of historical payout bands rather than nominal yields alone. Long-term capital preservation depends on acquiring defensive assets when yield spreads widen to reflect balanced or pessimistic valuation environments.
To navigate this valuation landscape, you can evaluate your broader allocation framework using our detailed dividend growth portfolio guide. Furthermore, examining the underlying mechanics of Altria Group (NYSE: MO) provides vital insight into cash-flow durability and capital allocation efficiency.
Understanding the Altria Dividend Yield and the 4.7% Payout Hike
The current Altria dividend yield reflects a forward payout of 4.44 dollars per share at a baseline stock price of 69.56 dollars, delivering a 6.38% to 6.40% annualized return. This valuation follows a 4.7% dividend increase, which underscores corporate cash-flow stability despite structural volume headwinds across legacy markets.
In August 2026, Altria announced that its Board of Directors approved an increase in the regular quarterly dividend from 1.06 dollars to 1.11 dollars per share. This distribution is payable on October 9, 2026, to shareholders of record as of September 15, 2026. Therefore, the annualized cash commitment expands to 4.44 dollars per share, representing the company’s 61st dividend increase over the past 57 years.
In addition, management reiterated its progressive corporate target to deliver mid-single-digit dividend growth annually through 2028. However, an expanded payout does not automatically signal an undervalued market entry point. Investors must systematically examine whether the Altria dividend yield offers an adequate margin of safety at present trading levels.
Historical Altria Dividend Yield Data and Long-Term Mean Reversion
A prevalent misconception among retail investors is that the normal Altria dividend yield averages 9% or higher over multi-year cycles. However, comprehensive empirical data covering 30 consecutive distribution cycles from March 2019 through June 2026 reveals an average yield of approximately 7.60%, with a median of 7.59%.
Historically, dividend yields exceeding 8.5% or 9% did not emerge from rapid cash payout expansions. Instead, those extreme readings reflected severe equity market sell-offs. For example, during the March 2020 liquidity shock, the yield spiked to 10.71%. Similarly, acute regulatory skepticism in late 2023 and early 2024 drove share prices into the low 40-dollar range.
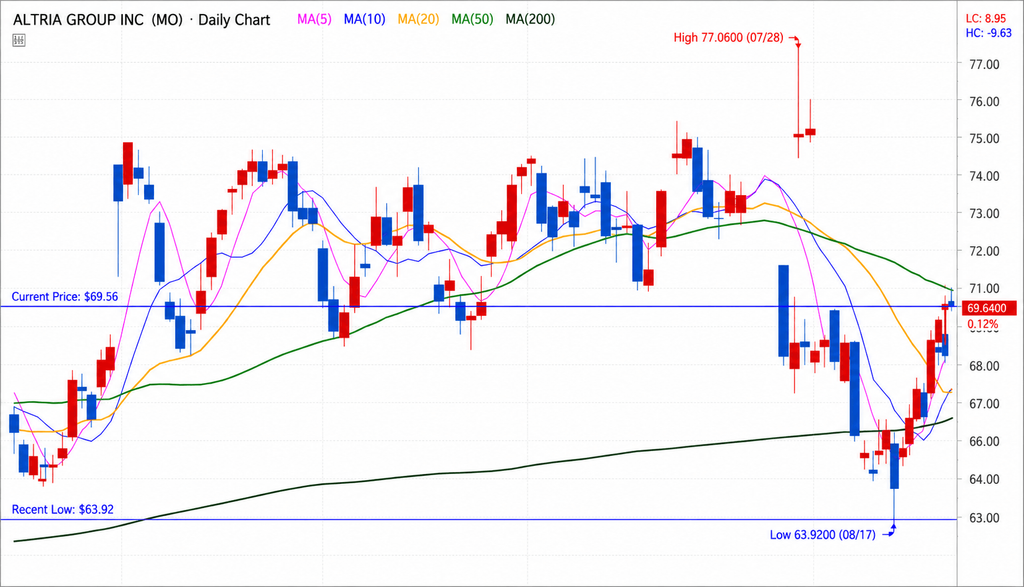
Consequently, elevated yields represent acute macro stress rather than historical fair value. During the recent pullback where the stock reached an intraday low of 63.92 dollars, the unadjusted trailing payout generated an effective yield of 6.63%. When recalibrated to the updated 4.44-dollar payout, that price level translates to an effective Altria dividend yield of roughly 6.95%, remaining below long-term baseline averages.
Target Altria Dividend Yield Valuation and 3-Step Accumulation Plan
To avoid chasing equity momentum, prudent investors calculate required price thresholds directly from annualized distributions. By dividing the forward payout of 4.44 dollars by historical yield targets, we establish an objective, stress-tested accumulation schedule.
| Target Stage | Target Altria Dividend Yield | Implied Entry Price | Discount from $69.56 | Strategic Assessment |
|---|---|---|---|---|
| Current Market | 6.38% – 6.40% | $69.56 | Baseline | Reflects dividend hike momentum; compressed yield margin |
| Observation Zone | 7.00% | $63.43 | -8.81% | Re-tests previous pullback lows; initial support check |
| Tranche 1 (Primary) | 7.50% – 7.60% | $59.20 – $58.42 | -14.89% to -16.01% | Converges directly with 7-year historical median baseline |
| Tranche 2 (Value) | 8.00% | $55.50 | -20.21% | Strong undervaluation zone with durable downside protection |
| Tranche 3 (Crisis) | 9.00% | $49.33 | -29.08% | Macro liquidity panic or acute regulatory disruption pricing |
Under this structured model, initial capital deployment occurs only when the market offers an Altria dividend yield matching the long-term historical average of 7.50% to 7.60%, corresponding to 59.50 to 58.40 dollars per share. Furthermore, a secondary tranche is deployed at 55.50 dollars, securing an 8.0% yield. Finally, reserve liquidity remains allocated for potential market dislocations near 49.33 dollars.
Why Dividend Capture Strategies Fail Around the Ex-Dividend Date
Some market participants attempt short-term dividend capture trading ahead of the September 15 ex-dividend cutoff. However, exchange rules automatically adjust opening quotes downward by the 1.11-dollar dividend amount. Therefore, short-term dividend capture strategies provide zero structural arbitrage advantage after factoring in mandatory withholding taxes and transaction expenses.
In addition, the 1.11-dollar price reduction accounts for only a 1.6% adjustment from current market levels. Consequently, an ex-dividend date adjustment alone cannot push the stock toward our primary entry threshold near 59 dollars. Real-time market distributions and verified SEC disclosure metrics can be validated directly through public financial repositories such as Investing.com Market Analytics.
Long-Term Income Strategy and Balance Sheet Resiliency
Long-term asset growth via the Altria dividend yield relies upon compounding cash distributions rather than seeking speculative short-term price appreciation. While traditional combustible product volumes face structural declines, Altria’s industry-leading pricing power and expanding modern smoke-free portfolio provide durable cash-flow generation.
Technical support structures remain active across weekly moving averages at 67.13 dollars, 65.62 dollars, and 64.54 dollars. Because the stock maintains robust intermediate price support, immediate precipitous declines appear improbable in the absence of macroeconomic shocks. Therefore, maintaining patience until the Altria dividend yield expands to historical baseline levels represents the most disciplined wealth accumulation strategy.
Frequently Asked Questions
Is the current Altria dividend yield of 6.4% an attractive buying opportunity?
While an absolute yield of 6.4% provides substantial cash flow, the valuation trades significantly above its historical 7-year average of 7.60%. Value-oriented income investors achieve superior risk-adjusted safety by awaiting pullbacks toward the 59-dollar range.
Can the upcoming ex-dividend date trigger a pullback to fair value?
The mathematical ex-dividend adjustment is limited to 1.11 dollars per share, or approximately 1.6%. Therefore, the ex-dividend event alone cannot bridge the gap to the historical average entry level without broader macroeconomic or industry-specific catalysts.
What is the advantage of using a 3-step accumulation model for Altria?
A multi-tranche accumulation framework prevents emotional chasing during cyclical rallies. By predetermining purchase thresholds at 7.5%, 8.0%, and 9.0% yield levels, investors average down effectively while maximizing long-term compounding efficiency.