
Deploying a structured McDonald’s accumulation strategy enables dividend growth investors to systematically navigate pullbacks, mitigating emotional drawdowns while steadily locking in superior distribution yields. When managing premium dividend franchises, broad market consolidations offer prime opportunities to lower cost baselines rather than triggering panic exits. Consequently, with the live portfolio recording a temporary unrealized drawdown of -4.58%, executing a disciplined McDonald’s accumulation strategy becomes paramount for long-term compound growth.
Equity markets periodically misprice defensive stalwarts due to short-term margin pressures and transient discretionary headwinds. However, disciplined allocators focus on operational cash generation and intrinsic asset strength. Furthermore, by cross-referencing pivot metrics with quarterly earnings data, investors can implement an actionable blueprint through a transparent McDonald’s accumulation strategy.
To compare defensive cash-flow metrics across other consumer stalwarts, check our in-depth Altria dividend yield and tranche valuation analysis.
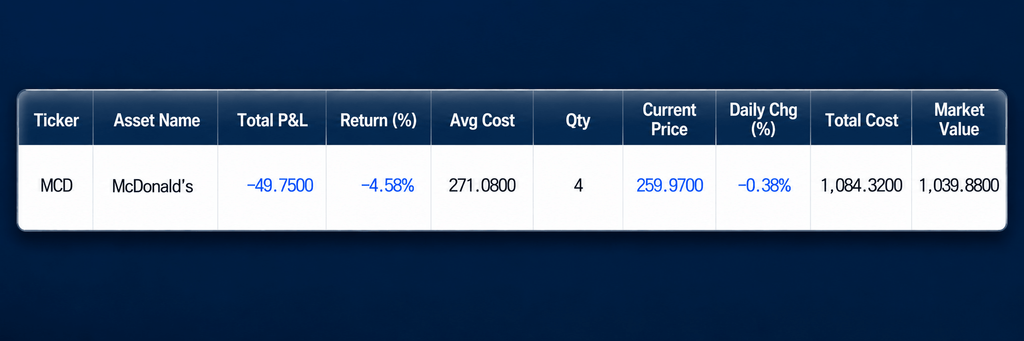
Live Account Holdings and Critical Pivot Boundaries
Direct Answer: A calibrated McDonald’s accumulation strategy anchors secondary buying at verifiable technical inflection marks between $258.00 and $254.00. Consequently, by initiating disciplined entries near historical support bands, allocators effectively insulate total capital while capturing an expanding 2.9% annualized dividend yield.
McDonald’s Corporation (NYSE: MCD) remains a cornerstone cash-generative asset within the global consumer segment. Currently, our live tracking portfolio holds 4 shares at an average entry baseline of $271.08. With the current market quote settling near $259.97, the unrealized position registers a loss of -$49.75, representing a -4.58% net drawdown.
Because the initial position constitutes a modest allocation, deploying a methodical McDonald’s accumulation strategy allows for precise risk control. In addition, avoiding intraday minute-chart noise ensures that capital deployment aligns exclusively with confirmed daily pivot structures and institutional liquidity zones.
“Asset drawdowns in proven dividend compounders do not represent permanent capital impairment; instead, they function as tactical entry windows where calculated tranche buying elevates aggregate portfolio yield.”
Presently, market trading centers right above the initial primary boundary at $259.80. Although an intraday low pierced downward toward $256.12, the daily close demonstrated significant absorptive demand. Furthermore, holding adjacent to the prior reaction trough of $260.06 establishes a credible double-bottom setup for our systematic McDonald’s accumulation strategy framework.
| Allocation Level | Target Range | Technical Metric Indicator | Strategic Tranche Action |
|---|---|---|---|
| Current Holdings | $271.08 (Avg) | 4 Shares Active (-4.58%) | Awaiting confirmation before Tranche 1 |
| Primary Support | $258.00 – $260.00 | Daily Pivot & Weekly S1 ($258.76) | Deploy 4 shares on structural double-bottom |
| Secondary Support | $251.00 – $254.00 | Weekly S2 Band ($252.52) | Deploy Tranche 2 limit orders at $254.00 |
| Terminal Defense | $244.00 – $247.00 | Weekly S3 Channel ($245.19) | Final tranche absorption on severe pullbacks |
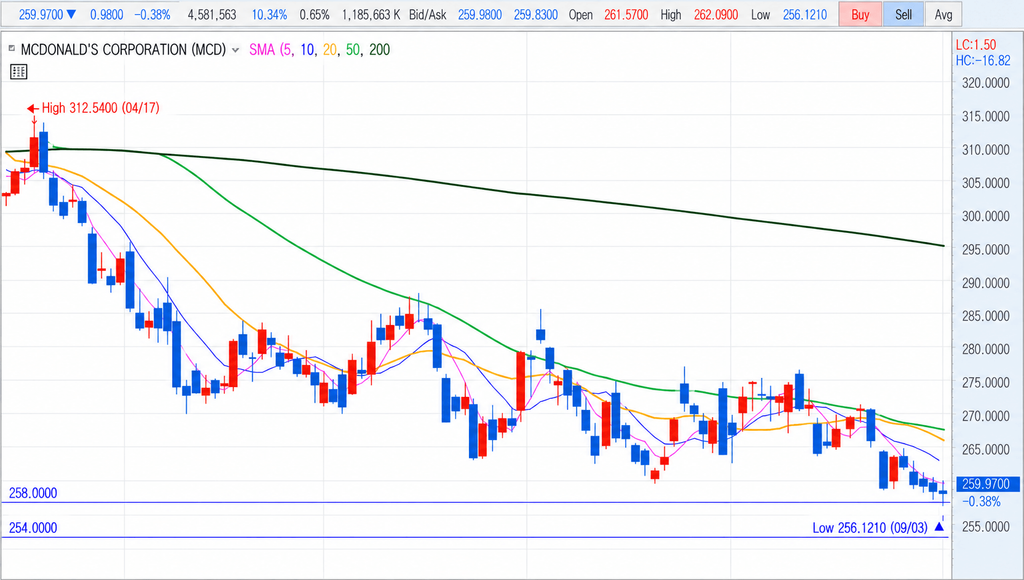
Valuation Multiples and Implied MCD Fair Value Bands
Applying normalized valuation metrics alongside conservative discounted cash flow calculations reveals an implied MCD fair value of $276.77 per share. Comparing this modeled intrinsic target against current prices highlights an accessible 6.6% discount margin. Therefore, executing a structured McDonald’s accumulation strategy provides a meaningful margin of safety against macro headwinds.
However, momentum indicators urge prudent pacing. The daily Relative Strength Index (RSI) hovers at 38.3, while the weekly reading prints at 33.7. Because readings remain above the canonical oversold line of 30, initiating lump-sum bets remains ill-advised. Instead, scaling into designated tranches keeps the overall McDonald’s accumulation strategy fully insulated from downside spikes.
The first accumulation tranche targets $258.00. This level corresponds with the weekly S1 pivot of $258.76, providing robust structural confluence. Adding 4 shares at $258.00 brings cumulative outlays to $2,116.32 across 8 shares. Consequently, this lowers the blended cost basis from $271.08 to roughly $264.54, allowing subsequent rallies toward the $266.00 resistance mark to flip the position into green territory rapidly through this active McDonald’s accumulation strategy.
Should broader systemic turbulence break initial defenses, our institutional MCD target price for secondary tranche accumulation sits firmly at $254.00 near the weekly S2 support. Given the company’s asset-light franchise fee architecture and sustainable 31.7% operating margins, prices breaching below $254.00 appear historically improbable outside severe global liquidity contractions.
Finally, if macroeconomic contagion forces an extension toward the weekly S3 boundary ($244.00 – $247.00), a final tranche will absorb supply. Real-time institutional consensus parameters, analyst upgrades, and historical volatility metrics can be tracked on Investing.com MCD Stock Overview for continuous validation.
Quarterly Fundamentals: Operating Resilience vs. Domestic Headwinds
A rigorous review of recent second-quarter performance validates the underlying thesis of our McDonald’s accumulation strategy. Adjusted diluted EPS reached $3.38, topping consensus projections of $3.34 by 1.20%. Highly lucrative royalty and leasing structures protected corporate profit margins despite persistent commodity pressures.
Conversely, quarterly revenues checked in at $7.10 billion, slightly trailing expectations of $7.14 billion. Persistent dining-out inflation pressured lower-income traffic across domestic outlets, while complex promotional configurations slowed counter execution. Consequently, management deferred its 50,000-unit global store expansion target from 2027 to 2028, causing multiple brokerages to adjust forward guidance downward to $295.00.
Nevertheless, international franchised performance maintained positive trajectory. International Operated Markets (IOM) and International Developmental Licensed Markets (IDL) delivered same-store sales growth of 1.5% and 1.9% respectively. In addition, global franchise stability reinforces the core assumptions of our operational McDonald’s accumulation strategy model.
Dividend Reliability and Cash Flow Compounding Mechanics
McDonald’s stands tall as an elite Dividend Aristocrat with over four decades of consecutive distribution hikes. The current annual dividend stands at $7.44 per share ($1.86 quarterly), driving a reliable forward dividend yield of 2.9%. Furthermore, this dependable yield provides substantial ballast during equity consolidation phases.
Tracking the latest MCD ex-dividend date dynamics demonstrates standard post-distribution price soft spots. Rather than signaling institutional exhaustion, these technical expirations offer opportune entry windows to expand income-generating assets. Hence, reinvesting distributions while scaling purchases remains central to our long-term McDonald’s accumulation strategy.
In summary, prevailing price concessions reflect short-term consumer adaptation rather than structural deterioration. Therefore, executing a patient McDonald’s accumulation strategy across the $258.00 and $254.00 thresholds secures superior risk-adjusted positioning as operational traffic normalizes.
Frequently Asked Questions
Q1: Why does the initial tranche of the McDonald’s accumulation strategy concentrate on $258.00?
The $258.00 boundary converges directly with daily pivot calculations and the weekly S1 support level of $258.76. Furthermore, holding adjacent to the $260.06 base forms a textbook double-bottom consolidation, presenting an asymmetric risk-reward profile for early position scaling.
Q2: How does the revised 50,000-restaurant timeline affect the underlying investment thesis?
While deferring the unit footprint timeline to 2028 prompted Wall Street price revisions toward $295.00, the company’s 31.7% net margin and positive international licensed market growth remain robust. Consequently, long-term capital allocation plans and dividend sustainability remain fully unimpaired.
Q3: What metrics establish the calculated MCD fair value estimate of $276.77?
The valuation reflects blended historical P/E multiples combined with multi-stage discounted cash flow projections. Trading beneath this fair value threshold confirms that our systematic McDonald’s accumulation strategy captures attractive intrinsic value alongside an expanding 2.9% dividend yield.
This publication represents personal portfolio execution tracking and objective financial market analysis. It does not constitute individual investment advice, a solicitation, or a recommendation to buy or sell securities. Multiples, fair value estimates, and technical support levels fluctuate according to macroeconomic conditions. All capital allocations carry risk of permanent loss; investors must conduct independent due diligence before committing capital.