
Market observers frequently witness paradoxical price action during big-tech earnings cycles, and the current Amazon stock drop analysis illustrates exactly why blowout headline numbers do not guarantee sustained upward momentum. During the second quarter of 2026, Amazon.com, Inc. (NASDAQ: AMZN) crossed the historic milestone of $200.60 billion in net quarterly sales while delivering an impressive diluted earnings per share (EPS) of $5.75, vastly outpacing analyst expectations of $1.81. However, after an initial post-earnings surge of nearly 20%, institutional selling quickly erased those gains as the stock retreated toward the $254 range. Understanding this sharp reversal requires separating backward-looking financial accomplishments from forward-looking cash flow obligations.
When high-growth mega-cap equities face severe downward revisions following exceptional reports, seasoned investors examine valuation adjustments rather than surface-level metrics. Amazon’s recent pullback stems from a classic “sell-the-news” dynamic compounded by mounting anxieties over aggressive capital expenditures. Consequently, institutional portfolios are recalculating the immediate discount rate applied to retail and cloud cash flows.
“Exceptional headline earnings can easily become secondary when a corporation’s forward capital commitments compress near-term free cash flow. In mega-cap tech, multiple contraction inevitably follows when capital expenditures outpace near-term monetization timelines.”
| Catalyst Category | Reported Data & Metric (Q2 2026) | Market Implication & Impact |
|---|---|---|
| Headline Earnings | Revenue: $200.60B | Diluted EPS: $5.75 | Initial +19.82% spike triggered aggressive liquidity exit |
| Capital Intensity | 2026 CapEx Guidance: ~$220B | Levered FCF: -$11.62B | Severe near-term liquidity squeeze and operating margin drag |
| Antitrust Inquiries | FTC Ad Auction Manipulation Allegations | Direct threat to high-margin $68B advertising division |
| Macro Consumer Data | E-Commerce Growth: 16% (June) down to 8% (July) | Consumer fatigue triggering forward valuation derating |
1. Portfolio Cost Basis and Capital Preservation Context
From an active portfolio allocation perspective, executing an objective Amazon stock drop analysis requires benchmarking current price weakness against verified entry levels to separate structural corporate deterioration from cyclical corrections. AMZN common shares have recently adjusted to approximately $254.37, following a pullback from local highs above $287. Maintaining an established position at an average cost basis of $238.6581 (8 shares) provides a functional +6.06% unrealized gain cushion, preventing reactionary trading mistakes during temporary distribution phases.
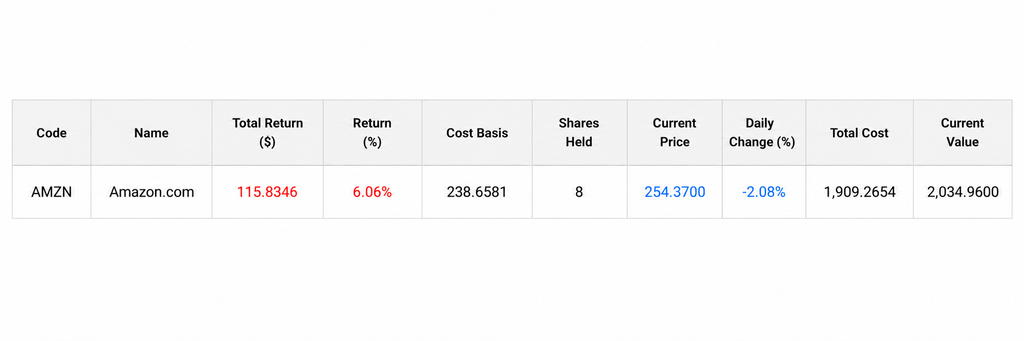
※ The image above displays authenticated brokerage execution data, presented via structured analytical layout to preserve data integrity without numerical alteration.
A calculated cost basis safety margin remains crucial because it insulates equity holders against emotional selling during volatile technical retests. As explored in our ongoing series on institutional risk management and tech portfolio rebalancing, capital deployment decisions must remain anchored to balance-sheet realities rather than emotional price swings.
2. The True Cost of AI Infrastructure: Severe CapEx and FCF Compression
A primary structural pillar in this Amazon stock drop analysis centers on the substantial acceleration of capital spending, which has triggered acute corporate free cash flow compression. Management elevated its full-year 2026 capital expenditure forecast toward roughly $220 billion, directing monumental capital allocations toward high-performance computing clusters, custom silicon development, and next-generation AWS data centers. While necessary to satisfy generative AI enterprise workloads, this expenditure directly challenges immediate balance-sheet liquidity.
According to analytical metrics compiled by Investing.com financial research intelligence, Amazon’s trailing levered free cash flow fell into negative territory at -$11.62 billion through the end of June 2026. Bulls champion this deployment as the indispensable foundation for accelerating cloud market dominance. Conversely, institutional bears argue that operating margins will face persistent dilution long before enterprise AI adoption delivers proportional top-line software margins. The current equity repricing clearly demonstrates that Wall Street has prioritized liquidity preservation over distant infrastructure monetization promises.
3. Antitrust Interventions and Retail E-Commerce Deceleration
Beyond capital expenditure concerns, regulatory friction has emerged as an acute downside catalyst. A comprehensive Amazon stock drop analysis must account for the Federal Trade Commission’s (FTC) renewed antitrust initiatives, specifically regarding allegations of manipulative ad auction floor pricing. Reports indicating that regulators plan to challenge automated pricing mechanics immediately sparked a single-session drop of 2.8%.
Amazon’s advertising division represents one of its most profitable revenue engines, delivering approximately $68 billion in fiscal 2025 revenues. Because digital ad placements carry exceptionally high operating margins, any structural legal challenge threatens to reduce enterprise profitability far more than traditional retail disruptions. Furthermore, broader macroeconomic indicators have worsened this sentiment. E-commerce transaction volume growth decelerated sharply from 16% in June down to just 8% in July, showing consumer fatigue that complicates Amazon’s high-volume retail fulfillment model.
4. Technical Candlestick Geometry: Testing Critical Moving Averages
From a chartist’s perspective, this Amazon stock drop analysis reveals a textbook corrective continuation pattern after AMZN peaked at its 52-week high of $287.20. Heavy-volume distribution bars pushed the price action decisively below the 20-day exponential moving average, transforming previous support shelves into overhead resistance zones.
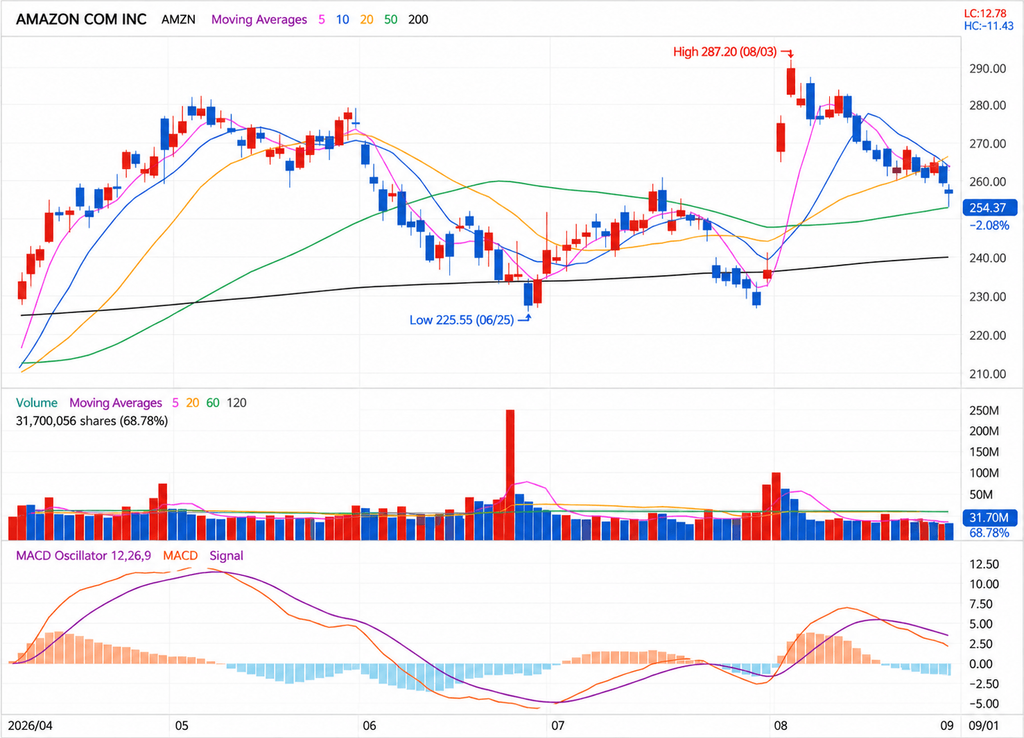
※ The technical graphic above details standardized market candlestick intervals and volume aggregates extracted directly from verified trading platform terminal feeds.
Key Price Levels and Quantitative Momentum Oscillators
- Primary Technical Support ($253.18): Represents the critical post-breakout shelf; an hourly close beneath this threshold risks exposing secondary baseline support at $249.24.
- Immediate Overhead Resistance ($260.42): Marks the lower boundary of the recent distribution channel, followed by dense supply concentrations at $263.72.
- Oscillator Readings: The daily Relative Strength Index (RSI) stands neutral at 46.3, while an Average Directional Index (ADX) reading of 30.3 confirms an active, entrenched short-term downward trend.
📌 Key Takeaways: Amazon Stock Drop Analysis
A rigorous Amazon stock drop analysis indicates that post-earnings volatility is driven by the $220B AI CapEx guidance rather than top-line weakness.
- Valuation & Capital: This comprehensive Amazon stock drop analysis confirms a negative levered FCF of -$11.62B as capital intensity expands.
- Technical Pivot: Chartist data in our Amazon stock drop analysis highlights $253.18 as the indispensable threshold before secondary risk at $249.24.
- Legal Exposure: Advertising auction probes by the FTC introduce operating margin uncertainty to the ongoing Amazon stock drop analysis.
5. Strategic Outlook and Institutional Synthesis
To summarize this Amazon stock drop analysis, the prevailing equity decline reflects a rational multiple compression driven by capital expenditure inflation, advertising litigation risks, and decelerating retail volumes. With forward price-to-earnings multiples moderating toward 19.7x, fundamental valuation appeals to value-oriented growth funds, yet technical momentum indicates that price discovery remains unresolved.
Consequently, conservative portfolio managers should monitor distribution volume around the $253.18 support level before initiating fresh tranches. If volume dry-ups confirm technical accumulation, accumulation becomes statistically favorable. However, a breakdown below $249.24 would suggest that this correction has further downside to explore.
Frequently Asked Questions (FAQ)
Q1. Why is this Amazon stock drop analysis focused on capital expenditures rather than record earnings?
A1. Although Amazon beat Q2 revenue and EPS targets, raising 2026 capital guidance to $220 billion resulted in a negative levered free cash flow of -$11.62 billion, causing institutional investors to de-risk over near-term margin dilution.
Q2. How significant is the FTC advertising inquiry for long-term Amazon fundamentals?
A2. Because advertising delivers over $68 billion annually at very high operational margins, regulatory challenges against auction floor mechanisms threaten the overall corporate operating profit mix.
Q3. What is the most critical technical price pivot identified in this Amazon stock drop analysis?
A3. The primary price level to defend is $253.18. A decisive breakdown beneath this shelf risks triggering stop-loss cascades toward secondary support at $249.24.