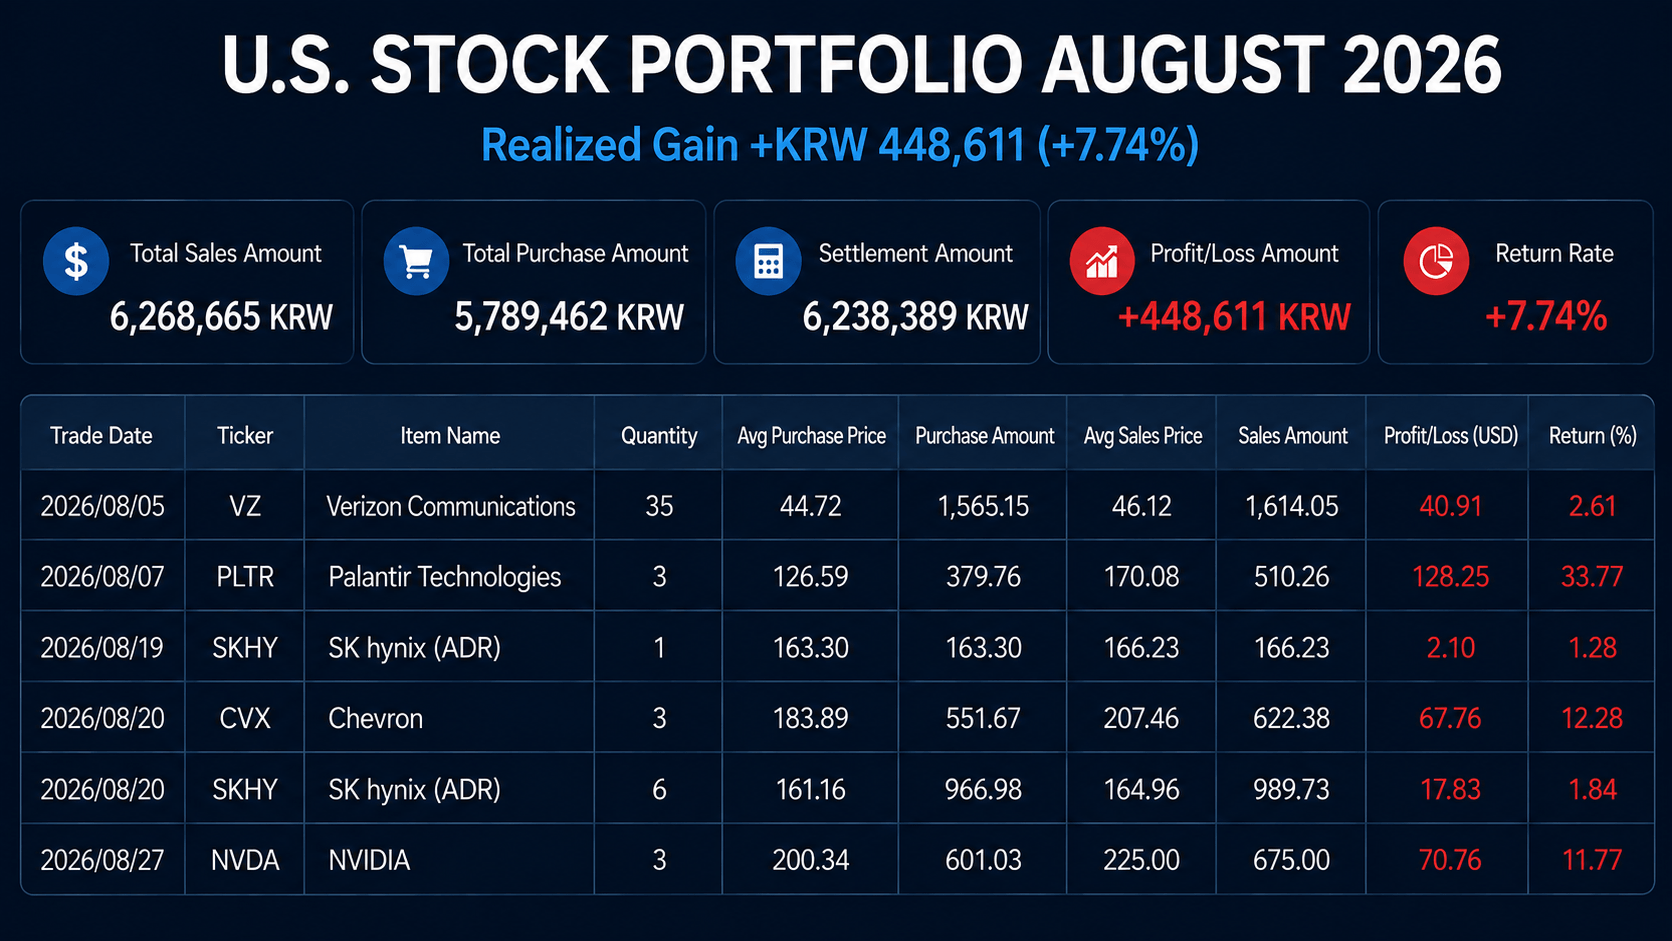
This August 2026 systematic portfolio review is based on the brokerage records used in the original portfolio log. The source summary reports a realized gain of $337.30, a +7.74% return, and 51 closed lots. The visible transaction rows, however, do not fully reconcile with those summary figures. This review therefore separates source-reported totals from calculations that can be reproduced directly from the displayed trade data.
For a later example focused on scheduled contributions and target weights rather than individual stock sales, see the September 2026 asset allocation DCA portfolio review.
Systematic Portfolio Review: August 2026 Realized Trades
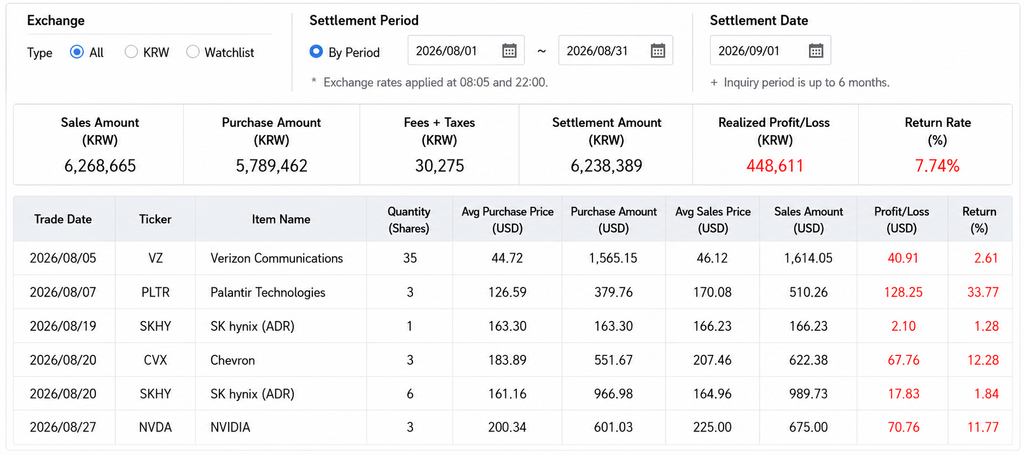
The August record lists sales in Verizon, Palantir, SK hynix, Chevron, and NVIDIA. The table below preserves the execution dates, quantities, average prices, net profit or loss, and return percentages contained in the supplied brokerage-based record.
| Execution Date | Ticker | Company Name | Quantity | Avg Buy ($) | Avg Sell ($) | Net P/L ($) | Brokerage-Reported Return (%) |
|---|---|---|---|---|---|---|---|
| 2026/08/05 | VZ | Verizon Communications | 35 | 44.72 | 46.12 | +$40.91 | +2.61% |
| 2026/08/07 | PLTR | Palantir Technologies | 3 | 126.59 | 170.08 | +$128.25 | +33.77% |
| 2026/08/19 | SKHY | SK hynix Inc. (ADR) | 1 | 163.30 | 166.23 | +$2.10 | +1.28% |
| 2026/08/20 | CVX | Chevron Corporation | 3 | 183.89 | 207.46 | +$67.76 | +12.28% |
| 2026/08/20 | SKHY | SK hynix Inc. (ADR) | 6 | 161.16 | 164.96 | +$17.83 | +1.84% |
| 2026/08/27 | NVDA | NVIDIA Corporation | 3 | 200.34 | 225.00 | +$70.76 | +11.77% |
| Displayed Row P/L Sum | +$327.61 | — | |||||
| Source-Reported Summary | 51 Lots | Settled Capital: $4,690.52 | +$337.30 | +7.74% | |||
The six displayed Net P/L values total $327.61, which is $9.69 below the source-reported $337.30 summary. In addition, dividing $337.30 by the displayed settled capital of $4,690.52 produces about 7.19%, not 7.74%. The supplied material does not provide enough information to reconcile either difference, so the summary figures are preserved as reported rather than presented as independently verified calculations.
The brokerage-reported return percentages also should not be reconstructed solely from the displayed average U.S. dollar buy and sell prices. For example, those two prices can produce a different simple percentage change from the percentage shown in the record. Fees, taxes, foreign-exchange treatment, settlement conventions, or another cost basis may affect the brokerage calculation. For this systematic portfolio review, the percentages are therefore identified as source-reported values.
What Remained in the Portfolio After the Sales
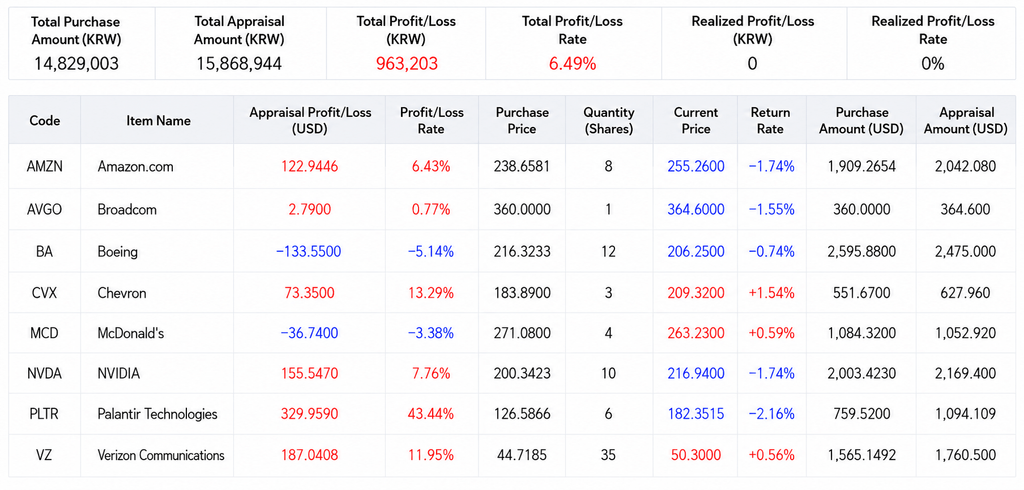
The holdings portion of this systematic portfolio review shows that the account still had exposure to both growth-oriented and cash-generating companies after the August transactions. The original HTML also listed aggregate invested principal, appraisal value, and unrealized gain, but those three figures did not reconcile arithmetically. This revision therefore relies on the position-level figures shown in the historical snapshot rather than restating an uncertain aggregate unrealized gain.
Technology and Growth Holdings
The supplied snapshot records Amazon (AMZN) at +6.43% on an average cost basis of $238.66, Broadcom (AVGO) at +0.77%, NVIDIA (NVDA) at +7.76% across the remaining 10-share position, and Palantir (PLTR) at +43.44% across the remaining shares. These are historical portfolio-snapshot figures rather than current market returns.
Dividend, Energy, and Consumer Holdings
The same snapshot records Verizon (VZ) at +11.95% and Chevron (CVX) at +13.29%, while Boeing (BA) was at -5.14% and McDonald’s (MCD) at -3.38%. A negative position-level return alone does not establish that a stock is undervalued or that averaging down is appropriate. Any additional purchase decision would require a separate review of company fundamentals, valuation, position size, and portfolio risk.
What Partial Trimming Changes—and What It Does Not
Selling part of a position converts part of an unrealized result into a realized result and raises cash, while the remaining shares continue to participate in future price movements. Partial trimming does not guarantee a better portfolio outcome, and a profitable sale should not automatically be described as portfolio rebalancing unless it is tied to a documented target allocation.
Investor.gov’s asset allocation and diversification guide explains that rebalancing is the process of bringing a portfolio back toward its intended asset mix after market movements cause allocations to drift. That distinction is useful when reviewing a trade log because a realized gain and a formal rebalancing decision are not necessarily the same event.
Three Practical Lessons From the August Record
- Separate realized and unrealized results. Closed trades show what has already been realized, while the positions that remain open can continue to gain or lose value after the review date.
- Keep the original trade rationale with the record. Dates, quantities, and prices show what happened, but they do not fully explain why a position was reduced unless that reason was documented when the trade was made.
- Reconcile summary totals before drawing broader conclusions. When account-level figures do not match visible line items, the discrepancy should be checked against the underlying brokerage statement rather than explained with assumptions.
For comparison, the April 2026 stock trading review also separates realized transaction data from conclusions that would require broader portfolio evidence.
A useful systematic portfolio review is less about labeling every profitable sale as proof of a successful strategy and more about keeping the record auditable: what was sold, what remained, what the brokerage source reported, what can be independently calculated, and where the available evidence is incomplete.
Investment Disclaimer
This publication is an independent investor’s historical portfolio record prepared for educational and analytical purposes. It is not financial, legal, or investment advice and does not recommend buying or selling any security. Market values and company fundamentals may change after the stated review period, and investors are responsible for their own research, decisions, and outcomes.