
Lockheed Martin stock support levels came into focus after LMT traded above $600 in mid-August 2026 and closed at $531.55 on September 2. The stock subsequently tested the low-$520s before recovering to $537.25 at the September 16 close. That price action keeps the $528–$532 area and the deeper $518–$521 area relevant as technical reference zones, but neither should be treated as a guaranteed floor.
The chart is only one part of the analysis. Lockheed Martin entered the second half of 2026 with stronger sales, substantial free cash flow, and a record backlog, while the F-35 continued to drive a meaningful share of Aeronautics growth. At the same time, government oversight reports continue to highlight F-35 sustainment costs and readiness challenges.
For that reason, this analysis combines recent LMT price behavior with the company’s latest operating results. The objective is not to predict an exact bottom, but to determine whether the original support areas remain useful and what could weaken that technical setup.
Table of Contents
LMT Fundamentals Behind the Technical Setup
Lockheed Martin’s second-quarter 2026 results provide an important fundamental backdrop for the chart. The company reported $20.063 billion in sales, up 11% from $18.155 billion in the year-earlier quarter. Net earnings reached $1.8 billion, or $7.94 per diluted share.
Cash generation was also strong. Lockheed Martin reported approximately $3.2 billion in cash from operations and $2.9 billion in free cash flow for Q2 2026. Backlog reached a record $230 billion, supported by $65 billion of new orders during the quarter.
Aeronautics remains central to the LMT investment case. The segment generated $8.112 billion in Q2 2026 sales and a 9.4% operating margin. Lockheed Martin said F-35 sales increased by approximately $475 million year over year, primarily because of higher production volume.
The F-35 is large enough to materially affect the entire company. Lockheed Martin’s 2025 Annual Report states that the program represented approximately 27% of consolidated sales in 2025, compared with 26% in both 2024 and 2023.
Investors can review these figures directly in Lockheed Martin’s Q2 2026 financial results and the company’s 2025 Annual Report.
These operating results do not determine where LMT shares will trade next. They do, however, provide context for evaluating whether a price decline is occurring alongside deteriorating business performance or against a backdrop of continued sales and cash-flow generation.
Lockheed Martin Stock Support Levels to Watch
The original September analysis centered on two areas: roughly $528–$532 as the first observation zone and approximately $518–$521 as a deeper technical reference area.
These ranges should be interpreted as chart-based observation zones rather than precise estimates of intrinsic value. Prior price reactions can help organize technical analysis, but they do not guarantee that buyers will continue to defend the same levels.
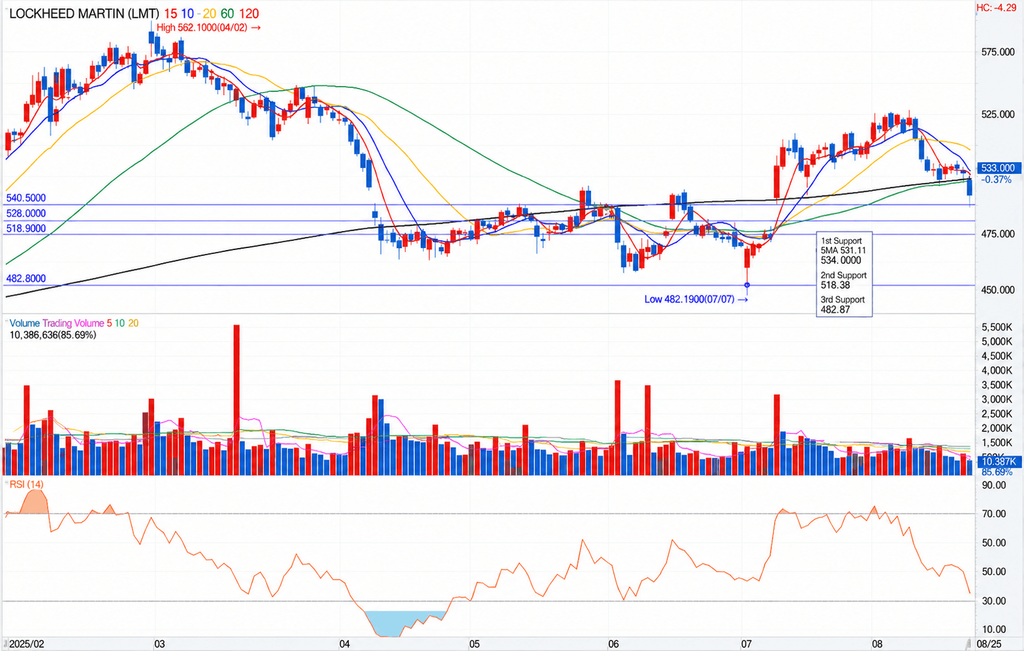
This September 2026 technical chart shows the LMT price zones used in the original support analysis. The levels are chart-based reference areas from that analysis, not guaranteed floors or estimates of Lockheed Martin’s intrinsic value.
| Reference Area | Price Zone | How to Interpret It |
|---|---|---|
| Near-Term Observation Zone | $528–$532 | Area surrounding the September 2 close and subsequent price action. Continued reactions here can help show whether buyers remain active near the low-$530s. |
| Deeper Observation Zone | $518–$521 | A secondary reference area from the original chart analysis if selling pressure pushes LMT below the first zone. |
| Technical Reassessment | Sustained break below the lower zone | Would weaken the original support thesis and make the new price structure more relevant than the previous support range. |
| September 16 Close | $537.25 | LMT finished above both observation zones after testing the low-$520s earlier in September. |
A similar distinction matters when using long-term moving averages. Our Broadcom 200-day moving average analysis provides another example of using technical levels as reference points rather than assuming that a moving average guarantees a rebound.
How LMT Tested the Support Area in September
The price action after September 2 provides a useful test of the original setup. LMT closed at $531.55 on September 2 after reaching an intraday low of $530.15. It closed at $532.95 the next session before falling to $525.28 on September 4.
After recovering to $536.15 on September 8, LMT came under renewed pressure. It closed at $524.46 on September 9 and then traded as low as $521.87 on September 11, finishing that session at $524.19.
The stock subsequently recovered, closing at $529.38 on September 14, $533.46 on September 15, and $537.25 on September 16.
This sequence is notable because LMT moved through the first $528–$532 observation area and approached the deeper zone without producing a sustained break below it through September 16. That does not prove the support area will hold in the future. It simply shows that the original zone remained relevant during the subsequent price test.
For technical analysis, that distinction matters. A price level becomes more informative when investors can compare the original thesis with what subsequently happened, rather than treating the initial forecast as permanently valid.
Why F-35 Risk Still Matters
Strong quarterly results do not eliminate the risks surrounding Lockheed Martin’s largest program. In June 2026, the U.S. Government Accountability Office reported that F-35 sustainment costs had continued to increase while fleet performance remained below goals.
According to the GAO, the F-35’s mission-capable rate declined from 67% in fiscal 2021 to 44% in fiscal 2025, while the full-mission-capable rate declined from 38% to 25% over the same period.
The F-35 Joint Program Office has responded with an updated sustainment strategy. GAO reported that meeting the strategy’s readiness goals would require the U.S. military services to provide approximately $13.7 billion more in F-35 sustainment funding than previously planned from fiscal 2026 through fiscal 2031. GAO also noted that approximately $2.2 billion of that total is what JPO officials specifically refer to as the GSS Reset, while the remainder largely addresses previously identified sustainment funding shortfalls.
Those figures are important for context, but they should not be translated directly into a specific LMT share-price target. Sustainment economics, production volume, contract structure, program performance, margins, and future appropriations interact in more complicated ways.
The primary government source is the June 2026 GAO report on F-35 sustainment and readiness.
What Would Weaken the Support Thesis?
The original technical thesis would become less persuasive if LMT established a sustained move below the deeper $518–$521 observation area. In that scenario, the more useful approach would be to reassess the chart using the new price structure rather than assuming that the old support level must eventually produce a rebound.
Fundamentals should also be reassessed alongside price. Future LMT results can be monitored for changes in Aeronautics margins, F-35 production volume, program charges, free cash flow, backlog conversion, and updated company guidance.
A recovery in the share price should be interpreted with the same caution. Trading back above an earlier technical level does not by itself mean that F-35 sustainment, contract performance, or margin risks have disappeared.
That is why technical analysis works better when paired with financial analysis. Our net debt analysis guide explains how debt, cash, free cash flow, interest expense, and capital structure can be evaluated together rather than relying on one balance-sheet number.
What the Current LMT Setup Tells Us
As of September 16, the original $528–$532 Lockheed Martin stock support area remains useful as a near-term technical reference, while the low-$520s represent the deeper area tested during the September pullback. LMT reached $521.87 intraday on September 11 before recovering to a $537.25 close on September 16.
The fundamental backdrop is more balanced than a simple F-35 cost narrative suggests. Lockheed Martin increased Q2 2026 sales by 11%, generated $2.9 billion of free cash flow, reached a record $230 billion backlog, and reported higher F-35 sales from increased production volume. At the same time, F-35 sustainment costs and readiness remain legitimate issues to monitor.
The practical takeaway is therefore not that one specific price represents a guaranteed entry point. The support zones provide a way to organize the chart, while subsequent earnings, cash flow, program performance, and price action determine whether the original thesis continues to hold.
Frequently Asked Questions
What are the main Lockheed Martin stock support levels in this analysis?
The original September 2026 analysis identified approximately $528–$532 as the first observation zone and $518–$521 as a deeper technical reference area. These ranges are based on the chart setup used in the original analysis and should not be interpreted as guaranteed price floors or estimates of intrinsic value.
Did the LMT support area hold after September 2?
Through September 16, the broader area remained relevant. LMT closed at $531.55 on September 2, later traded as low as $521.87 on September 11, and recovered to $537.25 by the September 16 close. That historical test supports continuing to monitor the zone, but it does not guarantee that the same levels will hold during a future decline.
How important is the F-35 program to Lockheed Martin?
The F-35 represented approximately 27% of Lockheed Martin’s consolidated sales in 2025. In Q2 2026, Lockheed Martin reported that F-35 sales increased by approximately $475 million year over year, primarily because of higher production volume. The program is therefore a major contributor to the business, while production, sustainment costs, readiness, and modernization remain important variables to monitor.
Investment Disclaimer
This article is for informational and educational purposes only and does not constitute personalized investment advice or a recommendation to buy or sell Lockheed Martin or any other security. Technical support levels are observational tools and may fail as market conditions change. Financial results and market prices reflect the dates stated in the article and may change. Investors should review current company filings and consider their own objectives, risk tolerance, and financial circumstances before making investment decisions.