
Navigating extended equity market cycles requires long-term allocators to look beyond daily price fluctuations and anchor portfolio decisions to verifiable cash generation. While nominal price momentum often reflects temporary market sentiment, applying a disciplined Dividend Discount Model provides a mathematical framework for evaluating shareholder distributions. For defensive dividend champions like The Coca-Cola Company (NYSE: KO), establishing an objective intrinsic value framework is essential for managing behavioral biases and identifying durable safety margins.
To thoroughly evaluate whether a firm’s operational cash generation supports sustained distributions without triggering balance sheet stress, review our foundational cash flow guide.
Dividend Payout Ratio Analysis: Free Cash Flow and Balance Sheet Stress-Testing
“The intrinsic worth of an enterprise represents the discounted sum of all future cash returned to owners, where minor variations in denominator assumptions exert outsized influence on terminal enterprise valuation.”
1. Dividend Discount Model & Core Financial Metrics Breakdown
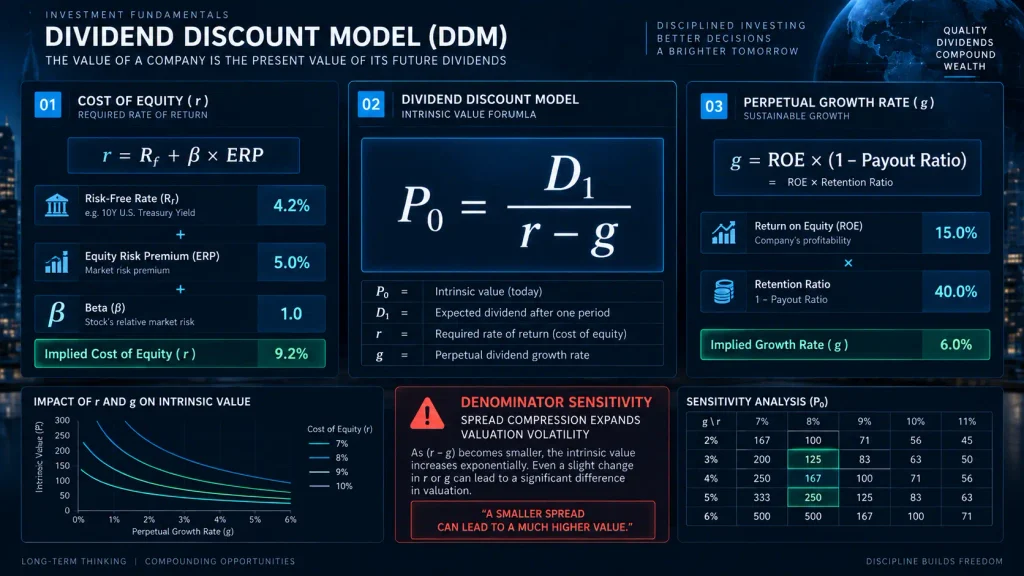
The Gordon Growth Dividend Discount Model calculates intrinsic equity value by dividing the forward projected dividend per share by the net spread between the investor’s required rate of return and the sustainable perpetual growth rate, establishing a quantifiable baseline for long-term equity accumulation.
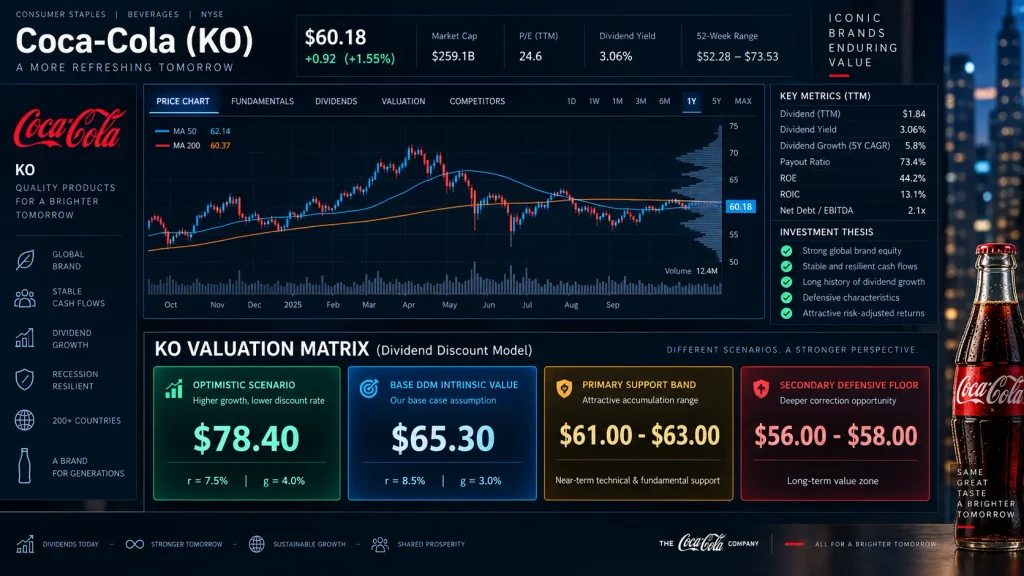
| Valuation Parameter | Conservative Stress Case | Base Research Baseline | Optimistic Growth Case |
|---|---|---|---|
| Forward Dividend ($D_1$) | $2.02 | $2.06 | $2.10 |
| Cost of Equity ($r$) | 7.50% | 7.00% | 6.80% |
| Perpetual Growth ($g$) | 3.00% | 3.85% | 4.12% |
| Intrinsic Value Target | $44.89 | $65.30 | $78.40 |
| Allocation Execution Plan | Secondary defense deployment | Primary support accumulation (30%) | Maintain disciplined cash hold |
Evaluating defensive dividend champions within retirement accounts like a Roth IRA or 401(k) demands quantitative rigor. Investors must distinguish between sustainable cash flow compounding and nominal yield chasing. The core formula operates as $P_0 = \frac{D_1}{r – g}$, where $P_0$ represents intrinsic equity value, $D_1$ reflects expected forward annualized distributions, $r$ represents the discount hurdle derived via the Capital Asset Pricing Model, and $g$ designates perpetual dividend growth.
To calibrate baseline hurdles, institutional analysts reference sovereign borrowing benchmarks published by the Federal Reserve Bank of St. Louis (FRED), utilizing the 10-Year Treasury Constant Maturity rate as an objective foundation for the risk-free rate ($R_f$) component within the CAPM equation: $r = R_f + \beta \times ERP$.
2. Balance Sheet Quality, Cash Flow Durability, and Capital Allocation
The operational foundation of The Coca-Cola Company rests upon high-margin concentrate licensing, global beverage distribution agreements, and substantial pricing power. With shares trading near $60.18 and a trailing dividend yield of 3.06%, the company continues to demonstrate robust fundamental resilience across volatile macro regimes. The business maintains a strong trailing return on equity of 44.2% and a return on invested capital of 13.1%, confirming sustained capital efficiency.
Examining cash generation, the company converts robust operational cash into approximately $9.8 billion in annual Free Cash Flow. While the accounting payout ratio stands at 73.4% on trailing GAAP earnings, sustainable organic cash flow fully covers common dividend obligations. This solid execution sustains a 5-year dividend compound annual growth rate of 5.8%, backed by over six decades of uninterrupted dividend expansion.
The firm maintains an investment-grade balance sheet with net debt to EBITDA controlled at 2.1x, comfortably inside management’s long-term target boundary. Staggered debt maturities and fixed-rate structures insulate operations from elevated policy rate environments, ensuring that debt service does not compromise ongoing shareholder capital return programs.
3. Valuation Band Modeling: Historical Multiples and Margin of Safety
Historical multiples indicate that the equity trades across a trailing P/E multiple of 24.6x within a 52-week trading range of $52.28 to $73.53. Under baseline research parameters, projecting forward cash dividends ($D_1$) at $2.06 per share, a required return ($r$) of 7.0%, and a conservative perpetual growth rate ($g$) of 3.85% produces an intrinsic baseline fair value of $65.30 per share: $P_0 = \frac{\$2.06}{0.070 – 0.0385} = \$65.30$.
Market pricing often fluctuates around technical inflection points, with shares trading near $60.18 sitting just below the 50-day moving average ($62.14) and converging toward the 200-day moving average ($60.37). In an optimistic scenario assuming an expanded growth trajectory of 4.12% against a 6.80% discount rate, the model yields an upper fair value target of $78.40.
Quantitative mapping reveals a primary support band between $61.00 and $63.00, aligning with multi-month accumulation shelves. A secondary defensive floor rests between $56.00 and $58.00, reflecting severe macro risk aversion and convergence toward a 3.6% yield boundary. Monitoring these defined support tiers allows systematic accumulators to establish attractive entry points rather than chasing market momentum.
4. Portfolio Integration: Rules-Based Execution and Risk Management
Within balanced institutional allocation models and long-term retirement accounts, core defensive holdings generally occupy an allocation band of 3% to 6% of total equity assets. Rather than committing entire capital allocations in a single transaction, portfolio managers implement a phased execution strategy. When market quotes hover above the intrinsic baseline of $65.30, new capital remains parked in short-duration Treasury vehicles yielding risk-free income while awaiting valuation normalization.
Upon technical retracement into the primary support band ($61.00 to $63.00), allocators initiate the first phase of deployment by committing approximately 30% of earmarked capital. Should broader systemic liquidation compress market quotes to the secondary defensive floor ($56.00 to $58.00), the remaining 70% of reserved capital is deployed in scheduled tranches. This approach locks in higher initial cash distribution yields while substantially insulating total return profiles from extended downside drawdowns.
However, structural limitations of the single-stage Dividend Discount Model require ongoing oversight. The model assumes indefinite dividend growth and cannot be applied to non-dividend enterprises or firms prioritizing opportunistic share repurchases over regular distributions. Consequently, allocators must continually benchmark model outputs against discounted free cash flow valuations and maintain 10% to 15% liquid liquidity buffers to preserve execution flexibility across shifting macroeconomic environments.
5. Frequently Asked Questions (FAQ)
How does the Dividend Discount Model handle sudden changes in interest rates?
Shifts in the macroeconomic interest rate environment directly influence the investor’s required rate of return ($r$) via the risk-free rate component. When baseline Treasury yields rise, the cost of equity expands, widening the $(r – g)$ denominator and reducing the calculated intrinsic fair value of the asset.
Why is the perpetual growth rate ($g$) capped at long-term GDP growth levels?
Mathematically, if an assumed perpetual growth rate ($g$) matches or exceeds the required rate of return ($r$), the denominator becomes zero or negative, causing the intrinsic valuation to fail. Economically, no individual corporation can outpace aggregate gross domestic product expansion indefinitely without eventually encompassing the entire economy.
What are the primary differences between the Gordon Growth Model and multi-stage DDM?
The Gordon Growth Model assumes a uniform, constant dividend expansion rate into perpetuity, making it best suited for mature, regulated consumer monopolies. In contrast, multi-stage models incorporate distinct high-growth, transitional, and mature phases, providing greater valuation accuracy for evolving businesses.
Regulatory & Investment Disclaimer
This research report is strictly for informational and educational purposes based on publicly available data. It does not constitute individualized investment advice, financial planning, or a solicitation to buy or sell securities. Past performance is no guarantee of future returns. Readers must conduct their own due diligence or consult a licensed fiduciary advisor.