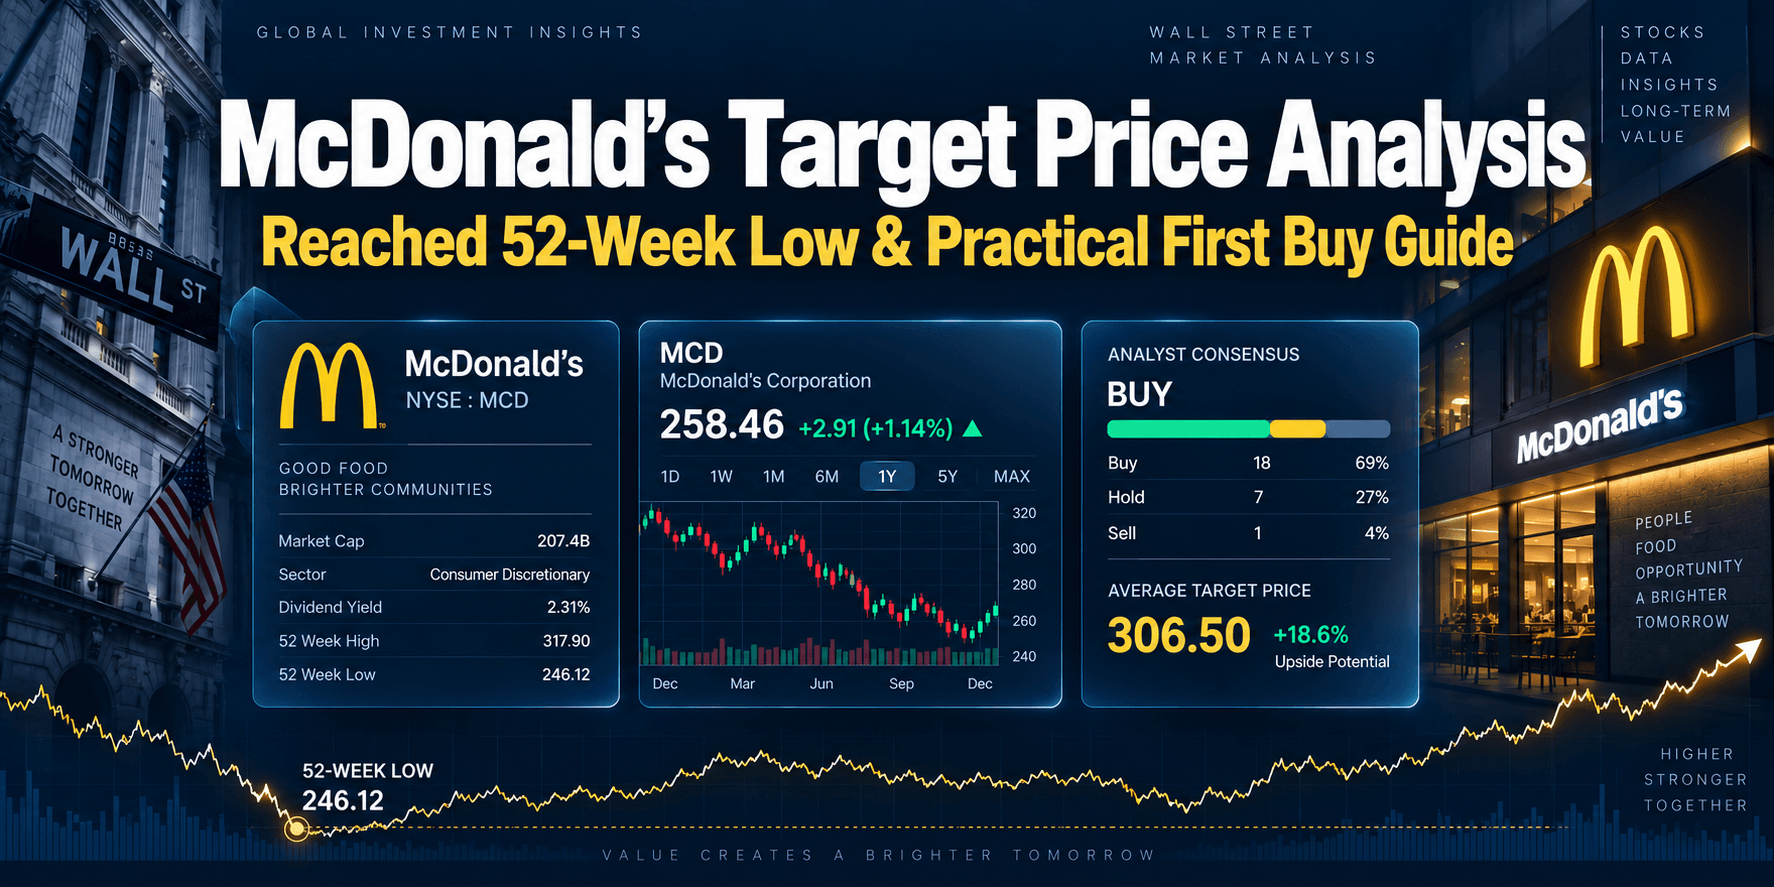
On September 4, 2026, McDonald’s (NYSE: MCD) closed at $255.69 after trading as low as $255.49 during the session. For an investor already holding four shares at an average purchase price of $271.08, the decline raised two separate questions: what valuation did the price imply, and whether an additional four-share purchase still fit the original plan.
This McDonald’s price target analysis is a historical review of the decision as it stood on September 5, 2026, not a current quote or a recommendation to buy at that level. It uses McDonald’s publicly reported earnings to construct transparent valuation scenarios, distinguishes an intended order from a completed trade, and examines why analyst targets and chart support levels are not guarantees of future returns.
The original trade-plan discussion followed an earlier McDonald’s accumulation strategy and appeared after a weaker U.S. comparable-sales result in the company’s second-quarter 2026 earnings release. A later post separately documents the September 8 purchase. Keeping those dates distinct is essential to evaluating the decisions without hindsight.
The September 4 Price and the Original Four-Share Position
The September 4, 2026 closing price was $255.69, compared with the existing position’s stated average cost of $271.08 per share. The original article described a plan to add four shares after the stock fell below a previously observed $258 reference level. At publication, that additional order was a plan, not a confirmed execution.
| September 4 snapshot | Amount | Basis |
|---|---|---|
| Shares held before proposed addition | 4 | Historical account record |
| Average purchase price | $271.08 | Historical account record |
| September 4 closing price | $255.69 | Historical market close |
| Original cost of four shares | $1,084.32 | 4 × $271.08 |
| Value at September 4 close | $1,022.76 | 4 × $255.69 |
| Price-only unrealized difference | −$61.56 (−5.68%) | Calculated before commissions, taxes, FX and other account adjustments |
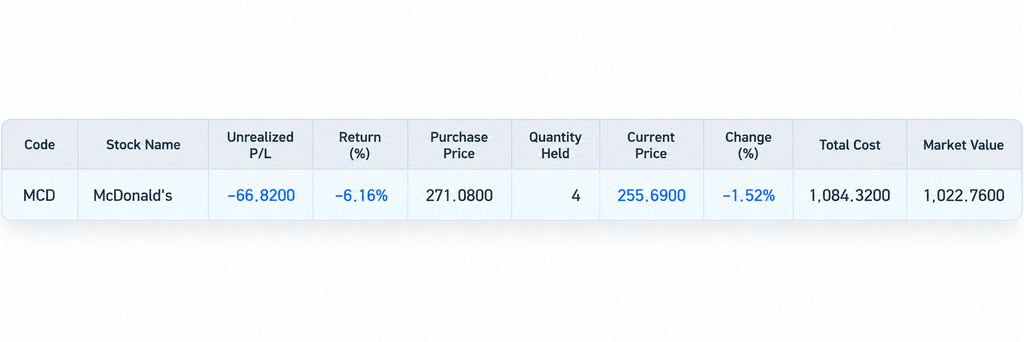
Archived image data caution: The original formatted account graphic reports an unrealized loss of −$66.82 (−6.16%), but it also shows a cost of $1,084.32 and market value of $1,022.76. Those latter amounts imply a price-only loss of −$61.56 (−5.68%). The displayed −$66.82 is approximately 6.16% of the stated cost, but it does not reconcile with the market value shown. The reason for that discrepancy cannot be established from this graphic alone. This revision retains the historic image for context rather than altering a purported account record, and uses the clearly defined price-only calculation in the table above.
This distinction is not merely cosmetic. A portfolio return quoted from a brokerage system may use an account-specific cost basis, currency conversion or adjustments, while a price-only calculation uses the two displayed share prices. An investor should not substitute one for the other without reconciling the underlying records.
What McDonald’s Q2 2026 Earnings Actually Showed
McDonald’s official second-quarter 2026 release reported global comparable-sales growth of 1.3% for the quarter ended June 30, 2026. U.S. comparable sales increased only 0.8%, versus 2.5% a year earlier. The company attributed U.S. comparable-sales growth to higher average checks, including favorable product mix, partly offset by negative comparable guest counts.
| Comparable-sales growth | Q2 2026 | Q2 2025 |
|---|---|---|
| United States | +0.8% | +2.5% |
| International Operated Markets | +1.5% | +4.0% |
| International Developmental Licensed Markets | +1.9% | +5.6% |
| Total company | +1.3% | +3.8% |
These operating results help explain why valuation assumptions deserved scrutiny in early September. U.S. sales growth remained positive, but fewer comparable guest visits meant the company was relying partly on average-check growth. That is not the same as evidence of improving customer traffic.
The same release reported quarterly revenue of $7.099 billion, GAAP diluted EPS of $3.32 and adjusted diluted EPS of $3.38. The adjusted result excludes specified restructuring-related charges; it should not be used interchangeably with GAAP EPS in a valuation calculation.
The franchise model also matters. McDonald’s reported that about 95% of its restaurants were franchised at year-end 2025. Royalties, rents and related franchise revenue can support corporate earnings and cash flow, but the business remains exposed to consumer traffic, franchisee economics, operating costs and reinvestment requirements.
A McDonald’s Price Target Analysis That Can Be Recalculated
The original article listed several sell-side price targets and a proprietary fair-value estimate as if they formed one directly comparable valuation range. Their historical source dates, estimate definitions and model assumptions were not documented sufficiently for this revision. They are therefore not treated here as verified price targets.
Instead, one transparent exercise is to apply illustrative price-to-earnings multiples to a specific reported EPS figure. McDonald’s FY2025 Form 10-K reported GAAP diluted EPS of $11.95 for the year ended December 31, 2025. Its adjusted diluted EPS was $12.20; the scenarios below deliberately use the reported GAAP figure rather than mixing the two definitions.
Using that historical GAAP EPS as a fixed denominator, the September 4 closing price of $255.69 represented approximately 21.40 times FY2025 earnings. The following multiples are illustrative assumptions, not verified historical averages, analyst forecasts or discounted cash-flow estimates.
| Illustrative P/E multiple | Implied price using $11.95 EPS | Price-only change vs. $255.69 |
|---|---|---|
| 20× | $239.00 | −6.53% |
| 22× | $262.90 | +2.82% |
| 24× | $286.80 | +12.17% |
Calculation: Implied price = selected P/E multiple × $11.95 FY2025 GAAP diluted EPS. Price-only change = implied price ÷ $255.69 − 1. The scenarios exclude dividends, taxes and transaction expenses. They are not forecasts or estimates of intrinsic value.
This exercise makes the valuation sensitivity visible: a two-turn change in the assumed earnings multiple changes the implied share price by $23.90, even though EPS stays fixed. Changes in future earnings would introduce another source of uncertainty.
The method also has a deliberate limitation. FY2025 EPS is a completed historical reporting period, not a current forward earnings forecast for September 2026. A forward P/E valuation would require an identified, dated earnings estimate and a defensible reason for the chosen multiple. A full discounted cash-flow model would require projected cash flows, reinvestment, discount rates and terminal assumptions.
For that reason, it would be misleading to label any single output above as McDonald’s definitive fair value or a guaranteed margin of safety. Analyst targets should likewise be evaluated as dated opinions that may change when estimates and economic conditions change. Public market commentary can be researched through sources such as Investing.com’s McDonald’s stock coverage, but a general quote page alone does not verify the provenance of a particular past broker target.
The Historical $258 Reference Level Was a Plan, Not a Price Floor
The original September trade plan identified $258 as an initial observation level, with $251–$254 and $244–$247 marked as possible lower-price areas for reassessment. These were the author’s historical decision levels; they were not independently verified permanent support zones or binding instructions for readers.
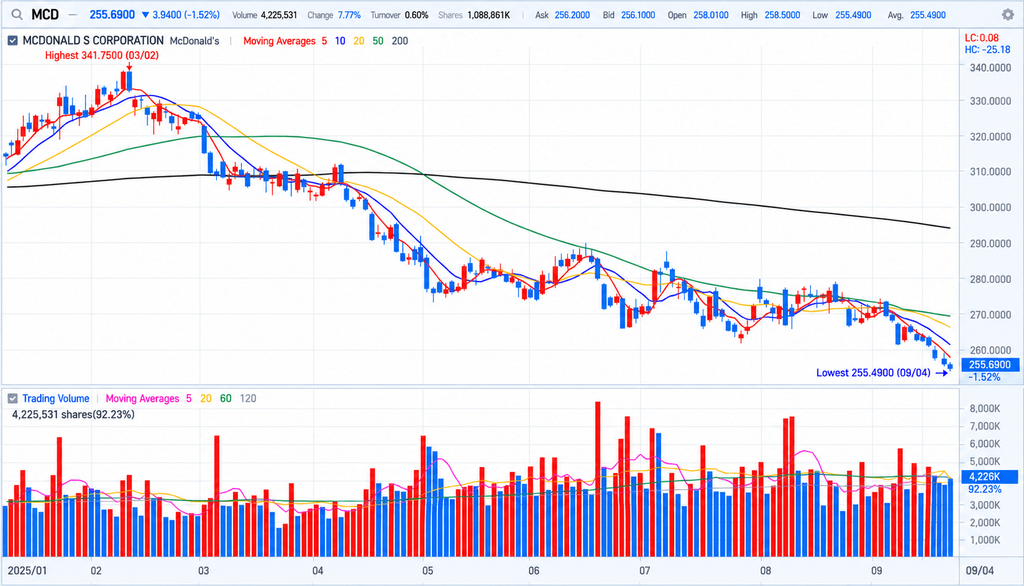
Historical chart retained from the original September 2026 publication. Its price bars and moving averages show the market context of that period; this revision does not independently recreate all indicator settings or establish the old pivot levels as reliable future support.
A quoted technical level should be evaluated together with the exact chart date, lookback period, indicator settings, trading volume and subsequent price action. Falling below a former support line does not, by itself, create a favorable entry or limit further losses.
The Four-Share Addition Was a Conditional Scenario
At the September 4 close, buying four more shares at exactly $255.69 would have produced the following hypothetical cost-basis calculation:
Illustrative addition at the historical closing price
Original cost: 4 × $271.08 = $1,084.32
Hypothetical additional cost: 4 × $255.69 = $1,022.76
Combined hypothetical cost: $2,107.08
Hypothetical average cost: $2,107.08 ÷ 8 = $263.385 per share (about $263.39)
This was a scenario, not an executed trade at the September 4 closing price. The U.S. equity market was closed for Labor Day on Monday, September 7, so an intended order at the next trading opportunity could not be assumed to fill at the prior Friday’s closing price.
A lower average cost also does not eliminate risk: the investor would have doubled the number of shares and increased the capital exposed to further price declines.
What the September 8 Follow-Up Recorded
A subsequent September 8 McDonald’s accumulation journal reported that an additional four shares had been purchased, bringing the position to eight shares with a reported average cost of $263.415. That later reported cost basis differs from the hypothetical $263.385 figure calculated using the September 4 close.
The two figures refer to different events. The September 5 article records the earlier planned transaction and its assumed price; the later journal records the subsequently reported purchase. This distinction preserves the chronology instead of rewriting the September plan as though the later execution price had been known in advance.
The later journal is a separate published investment record. This revision has not independently authenticated its original brokerage fill confirmation.
What Would Have Changed the Original Valuation View?
For the September 2026 thesis, the most useful follow-up evidence would have come from McDonald’s next comparable-sales results and from changes in traffic versus average check. Stronger traffic could have supported more favorable earnings assumptions; sustained negative guest counts could have challenged them.
Operating margins, capital expenditures and the cash required to support the restaurant system also matter. The Free Cash Flow Guide explains why reported earnings and cash available after capital spending are related but different measures.
Finally, a price target needs both an earnings assumption and a valuation assumption. If either changes, the resulting target changes. The historical September 2026 analysis therefore serves best as an example of how to document an investment decision and its uncertainty, rather than as a standing price recommendation.
Frequently Asked Questions
Was $255.69 the price paid for the second four-share purchase?
No. In this article, $255.69 is the verified September 4, 2026 closing price used for the historical scenario. The separate September 8 purchase journal reports the later transaction and a different resulting average cost. The closing-price calculation should not be presented as a brokerage execution record.
Does buying below an analyst target mean the stock offers a margin of safety?
Not necessarily. An analyst target is conditional on earnings forecasts, multiples, discount rates and other assumptions. A target above the market price does not establish intrinsic value or limit downside risk. Investors should check the report date, methodology and changes in estimates.
Can a technical support level justify a purchase by itself?
No. Support is an observation about historical market behavior, not a guaranteed floor. The reliability of a level depends on the underlying price series, volume, indicator definitions and market conditions. It should be evaluated with the company’s operating results, valuation and position risk.
Bottom Line
The September 4, 2026 McDonald’s close of $255.69 provided a reference point for a planned four-share addition. Its economic meaning depended on company performance, a justified valuation method and the investor’s existing position, not merely on how far the price had fallen.
McDonald’s Q2 results showed positive but slowing U.S. comparable sales, while the company’s FY2025 GAAP EPS offered a reproducible starting point for illustrative P/E scenarios. Neither data point established a guaranteed price floor.
The most important record-keeping lesson is to keep a historical plan, hypothetical cost-basis arithmetic, subsequent brokerage execution and third-party price targets separate. That makes the investment journal more useful to readers without changing what was known at the time.
Investment Disclaimer
This article is for educational and research purposes only and is not a recommendation to buy or sell McDonald’s shares or any other security. The prices, financial results and investment plan discussed are historical and are not current quotations. Market data and assumptions can change. Investors are responsible for their own decisions and outcomes.