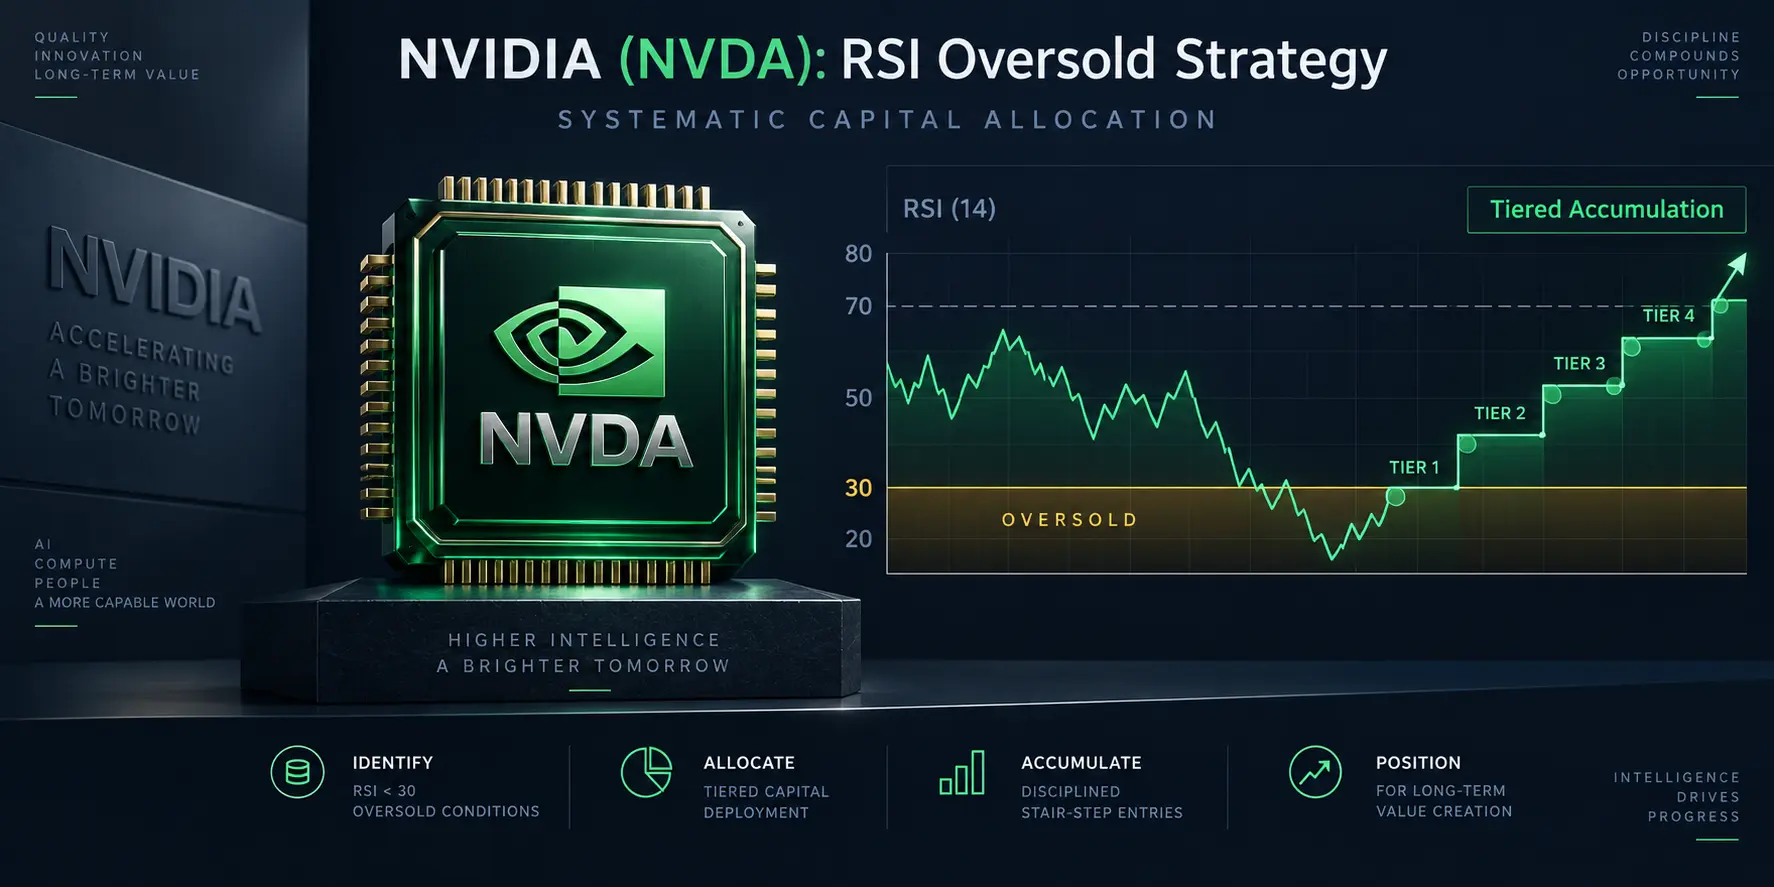
An RSI reading below 30 can draw attention to NVIDIA (NVDA) after a substantial stock-price decline. It does not establish that the stock is undervalued, that selling has ended, or that a recovery is imminent.
A useful NVIDIA RSI oversold strategy treats the Relative Strength Index as a momentum indicator, not an automatic purchase instruction. The indicator can help investors identify changes in the balance of recent price gains and losses. Before interpreting a reading as an opportunity, investors still need to examine the prevailing price trend, the underlying business, and their portfolio risk.
This article explains how RSI(14) is calculated, why its traditional oversold threshold can generate misleading signals, and how investors can assess historical price behavior without relying on unverified technical support bands.
An earlier version of this analysis identified specific NVIDIA purchase ranges. Those ranges were not supported by a reproducible, dated price series and documented indicator settings. They are retained below only as historical research context, not as verified present-day support levels.
What investors should know about RSI
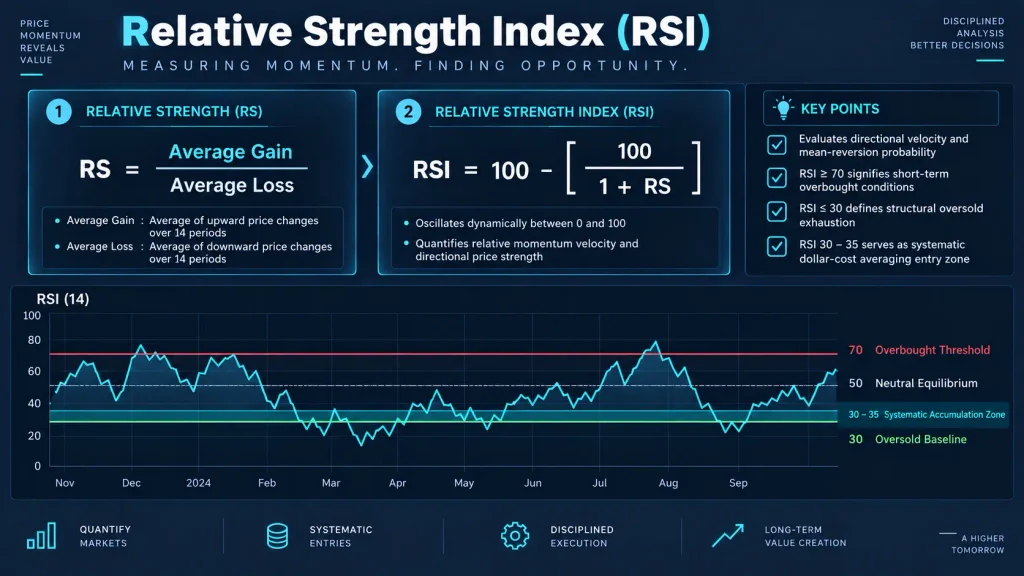
RSI below 30: A conventional oversold observation, not proof of a market bottom.
RSI near 50: Recent average upward and downward price changes are more balanced.
RSI above 70: A conventional overbought observation, not an automatic sell signal.
Actual interpretation depends on the lookback period, chart timeframe, market trend, and price behavior.
How the RSI Indicator Works
The Relative Strength Index was developed by J. Welles Wilder Jr. It measures the magnitude of recent positive and negative price changes and converts their relationship into a value between 0 and 100.
The traditional setting is RSI(14), which uses 14 periods. On a daily chart, those periods are trading sessions. On a weekly chart, they are weeks. A weekly RSI(14) therefore does not measure the same timeframe as a daily RSI(14).
The standard formula is:
Relative Strength (RS) = Average Gain ÷ Average Loss
RSI = 100 − [100 ÷ (1 + RS)]
In Wilder’s original method, the initial average gains and losses are calculated from the selected lookback period. Subsequent values use Wilder’s smoothing process, which incorporates the prior averages and the newest price change.
Different charting platforms and calculation methods can produce small differences, especially when the available price history or initialization method differs.
For a technical reference, Fidelity’s Relative Strength Index guide explains the conventional 30 and 70 thresholds, trend ranges, divergences, and limitations.
An Illustrative RSI Calculation
Consider a hypothetical sequence in which the relevant smoothed average gain is 1.20 price units and the smoothed average loss is 2.80 price units.
RS = 1.20 ÷ 2.80 ≈ 0.4286
RSI = 100 − [100 ÷ (1 + 1.20 ÷ 2.80)] = 30.00
The calculated reading is 30.00 under these assumptions. This example demonstrates the relationship between average gains and losses. It is not a calculated NVIDIA RSI value or a reconstruction of the stock’s historical chart.
A reading near 30 indicates that recent downward price changes have been large relative to upward changes under the selected methodology. It does not reveal the company’s intrinsic value or how far the stock could still decline.
What RSI Below 30 Does—and Does Not—Tell an NVIDIA Investor
RSI below 30 is conventionally described as oversold. The word can be misleading if investors interpret it as evidence that a stock has become fundamentally cheap.
An oversold RSI reading describes recent price momentum. It does not measure price-to-earnings ratios, discounted cash flow, revenue growth, or a business’s competitive position.
For NVIDIA, this distinction is especially important because expectations for AI computing demand, data center investment, semiconductor supply, profit margins, and future earnings can influence the valuation investors are willing to pay.
Even a company with substantial operating profits and strong market positioning can experience a prolonged stock-price decline when growth expectations or valuation multiples change.
Why an Oversold Stock Can Keep Falling
Suppose NVIDIA’s daily RSI reaches 29 during a broad technology-sector selloff. The reading indicates relatively weak recent price momentum.
If the stock continues recording substantial daily losses, RSI may remain below 30 or move lower. A small price recovery can temporarily lift RSI without confirming that the broader downtrend has ended.
This is one reason a deeply oversold reading should not be treated as a guaranteed reversal signal.
Momentum indicators are particularly vulnerable to misleading interpretations during prolonged downtrends, sharp changes in earnings expectations, and periods of unusually high volatility.
Why an RSI Reading Above 70 Is Not Automatically Bearish
The opposite interpretation can also be misleading.
RSI above 70 is conventionally described as overbought. A strong uptrend can nevertheless persist while the indicator remains elevated.
Automatically selling when RSI exceeds 70 may cause an investor to exit a continuing trend. Similarly, automatically buying below 30 may create exposure to a declining trend before a meaningful reversal develops.
The thresholds describe momentum conditions. They do not determine investment value or provide a complete trading strategy.
RSI Interpretation Depends on the Price Trend
Investors can gain more context by comparing the oscillator with the underlying price chart.
Rather than treating all RSI readings as equivalent, consider the following broad analytical situations.
| Observed Condition | Possible Interpretation | Additional Evidence Needed |
|---|---|---|
| RSI falls below 30 during a strong downtrend | Downward momentum is pronounced | Price stabilization, trend structure, earnings outlook |
| RSI rises above 30 after an oversold reading | Selling momentum may be moderating | Follow-through in price, volume, and broader trend |
| RSI stays near 40 during an uptrend | A pullback may be occurring within a stronger trend | Higher lows, moving-average direction, broader market conditions |
| RSI remains above 70 | Upward momentum is strong | Trend persistence, valuation risk, changing fundamentals |
These situations are analytical examples rather than statistically verified trading signals for NVIDIA.
The usefulness of any threshold depends on the security, its historical behavior, the indicator calculation, and the economic environment. A threshold that appeared useful during one market regime may not work as well during another.
Moving Averages and RSI Answer Different Questions
A moving average smooths historical prices to provide a reference for the direction of the underlying trend. RSI measures the relative magnitude of recent gains and losses.
Combining the two indicators may help distinguish a short-term momentum decline from a longer-term trend change. It does not guarantee that either indicator will identify a market bottom.
What a 200-Day Moving Average Can Show
The 200-day simple moving average and 200-day exponential moving average are different calculations.
A simple moving average assigns equal weight to the closing prices in its observation window. An exponential moving average gives greater weight to more recent observations under its smoothing formula.
Consequently, a 200-day SMA and a 200-day EMA should not be treated as identical price levels.
Before reporting an exact NVIDIA moving-average value, an investor should identify the observation date, adjusted-price convention, indicator method, and underlying historical prices.
A moving average may serve as a reference for trend analysis. It is not a permanent support floor, nor does the presence of a moving average ensure that institutional investors will buy at that level.
RSI Divergence Requires Confirmation
A bullish RSI divergence is commonly discussed when price records a lower low while the oscillator records a higher low.
Such a pattern can suggest that downward momentum is weakening. It does not establish that the stock has finished declining.
Divergences may persist, fail, or be followed by additional price losses. The strength of a potential signal depends on the broader trend, time horizon, and subsequent price behavior.
An investor evaluating divergence should document the specific dates and values used rather than relying on a general claim that the pattern is present.
Why the Earlier $140–$170 NVIDIA Band Is Not a Verified Price Floor
The original version of this article discussed $165–$170 as an initial observation area and $140–$148 as a lower reference range, collectively described as a $140–$170 accumulation band.
These figures are part of the article’s historical analytical record. They should not be carried forward as confirmed support levels without a dated price series, a reproducible technical method, and evidence that the relevant chart period matches the quoted prices.
The original graphic associated these ranges with a 200-day exponential moving average and an oversold RSI reading. However, its displayed prices, indicators, and timeline could not be reconciled with independently verified historical NVIDIA price data.
For that reason, the old chart is not reproduced in this revised analysis, and its numerical overlays are not presented as verified market measurements.
This does not mean that a stock price cannot revisit a previously observed range. It means an investor should not treat a historical number as a current technical signal without checking the data again.
Any updated NVIDIA technical analysis should specify the exact observation date, chart timeframe, adjusted closing-price series, RSI methodology, and the source used for moving-average and volume measurements.
RSI Oversold Strategy: How to Evaluate Signals Without Automatic Buying Rules
A useful process separates observation, investigation, and investment decisions.
- Identify the timeframe. Record whether the reading comes from daily, weekly, or another series. RSI(14) uses 14 observations of the selected timeframe.
- Verify the indicator. Confirm the underlying price data, calculation method, and date. Do not infer an exact RSI number from the current share price alone.
- Examine the price trend. Determine whether the stock is trading in a broader uptrend, downtrend, or consolidation. An oversold reading in a persistent downtrend carries different risks from a brief pullback within an established uptrend.
- Look for independent evidence. Price stabilization, changing volume, moving-average direction, or a confirmed change in price structure can provide context. None is infallible.
- Review company fundamentals. Determine whether the decline is occurring alongside changes in revenue expectations, profitability, customer demand, competitive conditions, or valuation.
- Review portfolio exposure. Additional purchases increase exposure to a single security. Investors should consider concentration, liquidity needs, and the possibility of further losses.
This process is not a trading system with demonstrated success probabilities. It is a way to reduce dependence on one indicator before making an investment judgment.
Why Fixed RSI-Based Allocation Percentages Need Testing
The earlier article proposed deploying 30% of reserved capital at one signal, another 30% after support confirmation, and the remaining 40% after a recovery indication.
Those percentages were not supported by an identified historical backtest or a documented portfolio risk model. They should therefore not be described as an established optimal allocation rule.
Position sizing is a separate investment decision. It depends on portfolio concentration, acceptable loss, account objectives, volatility, investment horizon, and the reliability of the analytical assumptions.
A rules-based process can still be useful when its rules are explicit and tested. However, a rule becomes more credible through consistent implementation and evaluation, not because it uses fixed percentages.
NVIDIA Fundamentals Must Be Evaluated Separately
Technical momentum cannot establish whether NVIDIA’s operating performance supports a particular valuation.
Investors examining the business can review NVIDIA’s FY2026 Form 10-K, for the fiscal year ended January 25, 2026, as a historical primary source.
The filing provides information about the company’s business, financial statements, competitive environment, customer concentration, supply arrangements, and other operating risks.
For an updated investment assessment, investors should also examine the most recent available quarterly filing and official earnings materials rather than treating the annual report as a current operating forecast.
Relevant questions include whether demand expectations are changing, how operating margins and capital requirements are developing, and whether the market price already reflects exceptionally strong future earnings.
Even if RSI signals weaker selling momentum, the share price may remain under pressure if earnings estimates or valuation assumptions continue to decline.
Investors looking at business quality can also examine ROIC vs. WACC: How to Measure Economic Profit and Capital Allocation to distinguish operating capital efficiency from the market price investors are willing to pay.
Single-Stock RSI Signals and Portfolio Risk
NVIDIA can represent a substantial source of semiconductor and AI-related exposure in a portfolio. Adding shares during a decline can increase concentration if the investor already owns large technology positions or growth-oriented index funds.
Before considering a tactical addition, it may be useful to examine existing exposure through broad-market and Nasdaq-focused funds.
Our VOO vs. QQQ Total Return and Drawdown Comparison discusses the differences between a broad S&P 500 portfolio and a more growth-oriented Nasdaq-100 allocation.
An oversold RSI reading does not reduce the fundamental risk of holding a concentrated position. It may identify a period of weaker recent price momentum, but it does not determine how much capital an investor should commit.
For investors reviewing broader financial conditions, the Federal Reserve Bank of St. Louis FRED database provides interest-rate and economic data. Such information may help frame the market environment, but it does not establish an NVIDIA-specific RSI signal or price floor.
Frequently Asked Questions
Is RSI below 30 a reliable buy signal for NVIDIA?
No single RSI threshold is a reliable standalone buy signal. An RSI reading below 30 indicates relatively strong recent downward price momentum under the selected calculation. NVIDIA can continue declining while its RSI remains oversold, particularly when the broader trend or fundamental expectations are deteriorating.
Should investors use daily RSI or weekly RSI?
The choice depends on the investment question. Daily RSI responds to momentum over a shorter observation window, while weekly RSI reflects changes across a longer timeframe. A weekly RSI(14) uses 14 weekly periods, not 14 trading sessions. Neither timeframe has a universally superior success rate, and combining them does not guarantee a favorable outcome.
Can an oversold reading near the 200-day EMA confirm support?
No. The relationship may be worth investigating, but confirmation requires the actual dated price data, the precise moving-average method, and evidence of subsequent price behavior. A stock can move below a long-term average and continue falling despite an oversold oscillator.
What Investors Should Take Away
An NVIDIA RSI oversold strategy is more useful as a research process than as a promise of an attractive entry price.
RSI measures recent price momentum. Moving averages provide trend references. Fundamental analysis examines the operating business and the assumptions behind its valuation. These tools answer different questions and should not be treated as interchangeable.
The earlier fixed dollar ranges and automatic allocation percentages did not meet the evidentiary standard needed to present them as verified trading signals. This revised analysis retains the relevant concepts while separating conventional technical definitions from unsupported price forecasts.
For investors, the practical task is to verify the data, examine the trend, understand the company’s earnings outlook, and manage portfolio risk before deciding whether an oversold condition is meaningful.
Investment Disclaimer
This article is for educational and investment research purposes only. It does not constitute a recommendation to buy or sell NVIDIA shares or any other security. Technical indicators and historical prices do not guarantee future results. Financial information, estimates, and market conditions can change over time. Investors are responsible for their own investment decisions and outcomes.