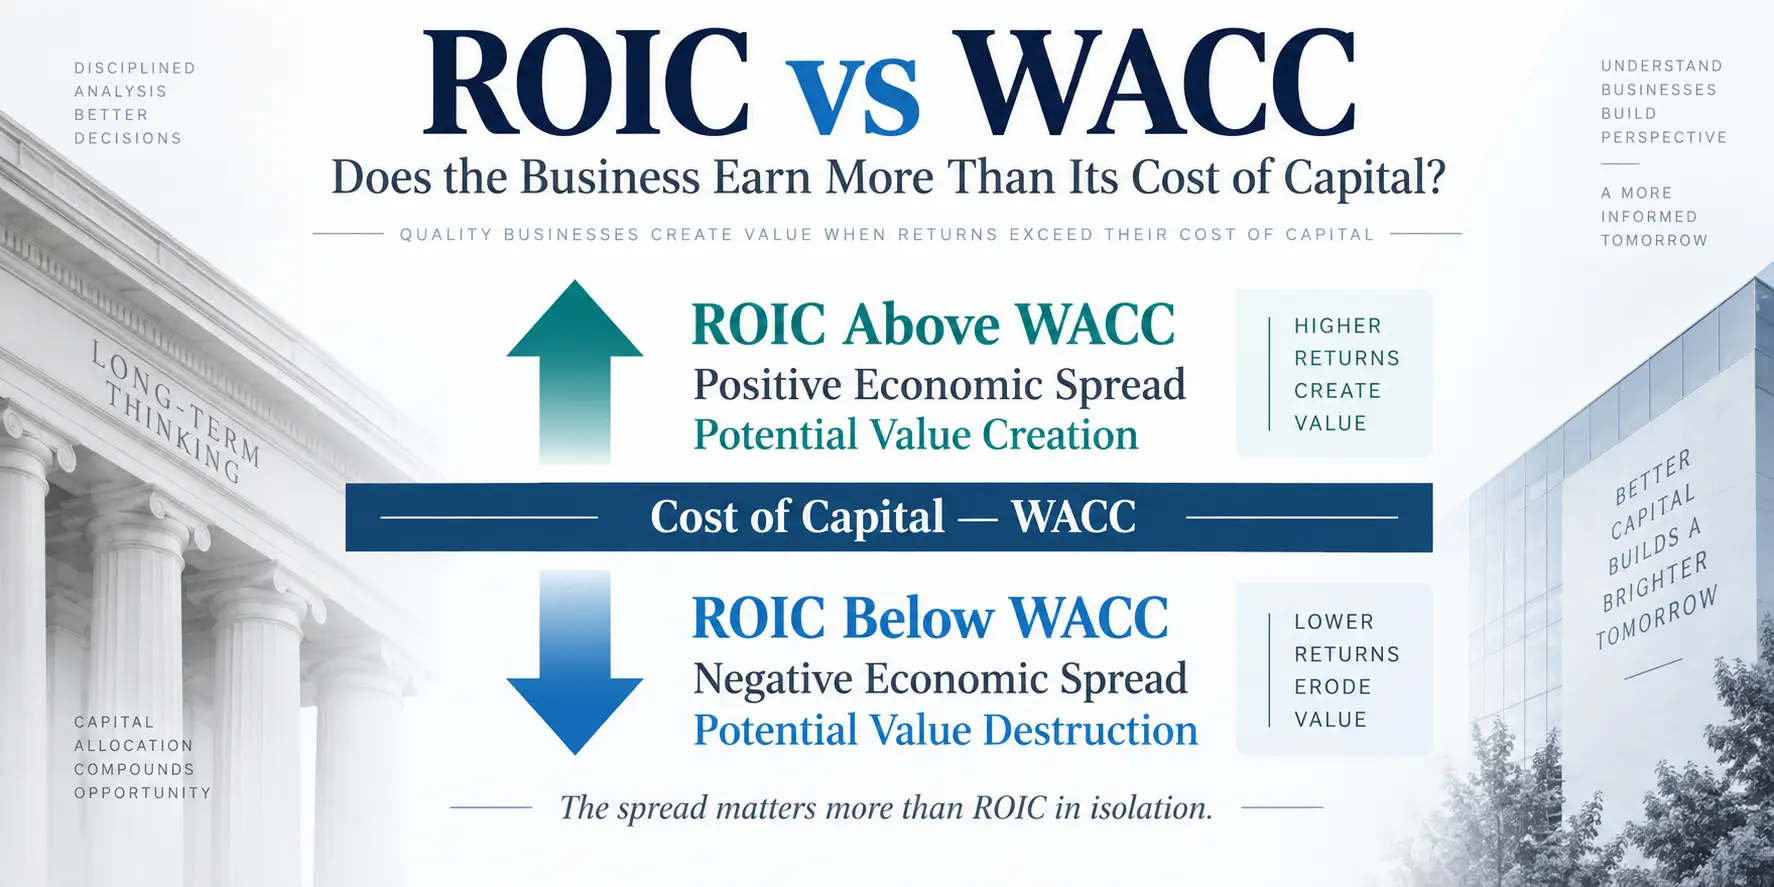
ROIC vs WACC is one of the simplest ways to test whether a company is creating economic value with the capital it uses. ROIC measures the operating return generated on invested capital. WACC estimates the return demanded by the investors and lenders who supply that capital. The difference between the two is the economic spread.
A 12% ROIC may look attractive on its own, but the interpretation changes dramatically depending on whether the company’s cost of capital is 6%, 10%, or 13%. That is why investors should avoid treating ROIC as a standalone quality score.
A practical ROIC vs WACC rule
ROIC above WACC: the business is earning more than its estimated cost of capital.
ROIC near WACC: the economic benefit of additional investment may be limited.
ROIC below WACC: expanding the capital base may destroy economic value if the gap persists.
If the distinction between shareholder returns and operating returns is still unclear, start with the ROE vs. ROIC capital efficiency guide. ROE and ROIC answer different questions, and that distinction matters before introducing the cost of capital.
Start With the ROIC–WACC Spread, Not ROIC Alone
Return on Invested Capital measures how efficiently a company generates after-tax operating profit from the capital committed to its operating business.
ROIC = NOPAT ÷ Average Invested Capital
NOPAT stands for Net Operating Profit After Tax. A simplified starting point is operating profit adjusted for taxes:
NOPAT ≈ EBIT × (1 − Tax Rate)
Weighted Average Cost of Capital approaches the problem from the opposite direction. Instead of asking what the business earned, WACC asks what return capital providers require for supplying debt and equity financing.
The difference is commonly expressed as:
Economic Spread = ROIC − WACC
Consider an illustrative business with $1 billion of invested capital and an estimated WACC of 8%. Holding the capital base constant makes the economic effect of different ROIC levels easy to see.
| ROIC | WACC | Economic Spread | Approx. Economic Profit on $1B | Interpretation |
|---|---|---|---|---|
| 6% | 8% | -2 percentage points | -$20 million | Return falls below the capital-cost hurdle |
| 8% | 8% | 0 percentage points | $0 | The business roughly earns its estimated cost of capital |
| 12% | 8% | +4 percentage points | +$40 million | Operating return exceeds the capital-cost hurdle |
The simplified economic-profit relationship is:
Economic Profit ≈ Invested Capital × (ROIC − WACC)
With $1 billion of invested capital, a 12% ROIC and an 8% WACC produce a 4 percentage-point spread. Multiplying $1 billion by 4% gives approximately $40 million of economic profit.
This does not mean shareholders automatically earn a 4% stock-market return. The calculation evaluates the economics of the operating capital base. Shareholder returns also depend on valuation, growth expectations, dilution, dividends, buybacks, and the price paid for the stock.
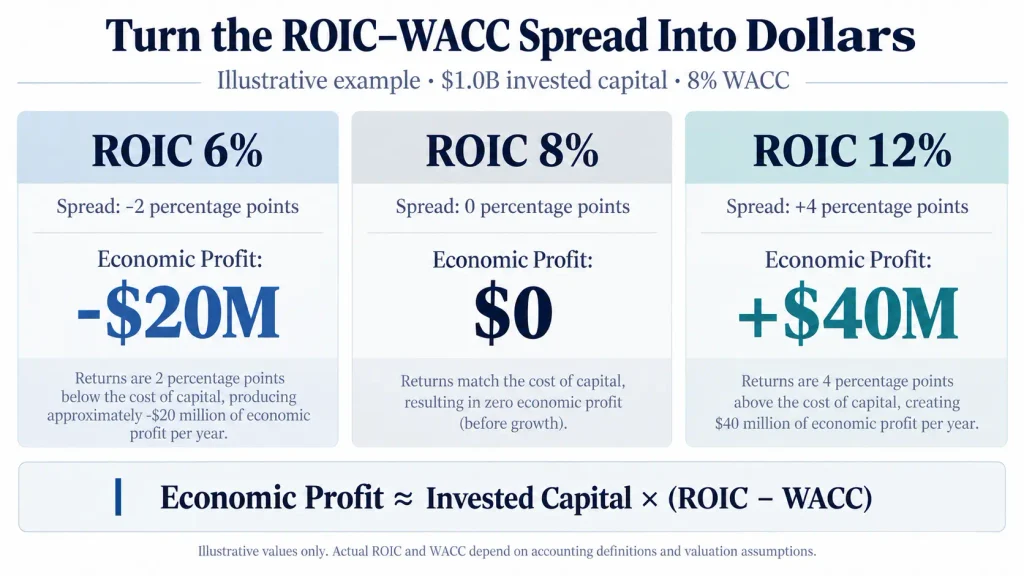
This illustrative example converts the ROIC–WACC spread into dollars. With $1 billion of invested capital and an 8% WACC, a 12% ROIC produces a +4 percentage-point spread and approximately $40 million of economic profit.
Capital Allocation Depends on Marginal ROIC
A historical ROIC tells investors how efficiently the existing capital base has performed. Management, however, must decide what to do with the next dollar of available capital.
That shifts the question from historical ROIC to marginal or incremental ROIC: what return might the next factory, data center, store, acquisition, software project, or research program generate?
Positive Spread With a Long Reinvestment Runway
If new projects are expected to earn returns comfortably above WACC, retaining cash and reinvesting internally may create more value than immediately distributing that cash to shareholders.
A simplified relationship often used to think about operating growth is:
Expected Operating Profit Growth ≈ Reinvestment Rate × Expected Return on New Capital
If a business can reinvest 50% of after-tax operating profit at an expected 20% return on new invested capital, the simplified relationship points to roughly 10% operating-profit growth. That is not a forecast. Competition, pricing, capacity limits, acquisitions, accounting changes, and execution can all cause actual growth to differ materially.
Positive Spread but Limited Reinvestment Opportunities
A mature company can have an excellent historical ROIC while lacking enough attractive projects to absorb additional capital at similar returns.
In that situation, forcing expansion can lower future returns. Dividends, debt reduction, or share repurchases may become more attractive alternatives.
Buybacks still require a valuation check. Repurchasing stock at an excessive valuation can destroy value even when the underlying operating business earns a high ROIC.
Negative Spread
When expected returns on new capital fall below WACC, expanding the capital base can make the company larger without making it economically better.
Management may need to reduce low-return capital spending, sell underperforming assets, restructure operations, reduce leverage, or exit projects that cannot clear the required return threshold.
| Capital Situation | Primary Question | Potential Capital Allocation Response |
|---|---|---|
| Marginal ROIC comfortably above WACC | Can the company deploy substantial additional capital at similar returns? | Reinvestment may deserve priority |
| ROIC above WACC, limited runway | Are attractive internal projects becoming scarce? | Consider dividends, buybacks, or debt reduction |
| ROIC near WACC | Is the expected return sufficient for the risk being taken? | Use a higher hurdle and invest selectively |
| Marginal ROIC below WACC | Why continue committing capital to a negative spread? | Reduce investment, restructure, sell assets, or redeploy capital |
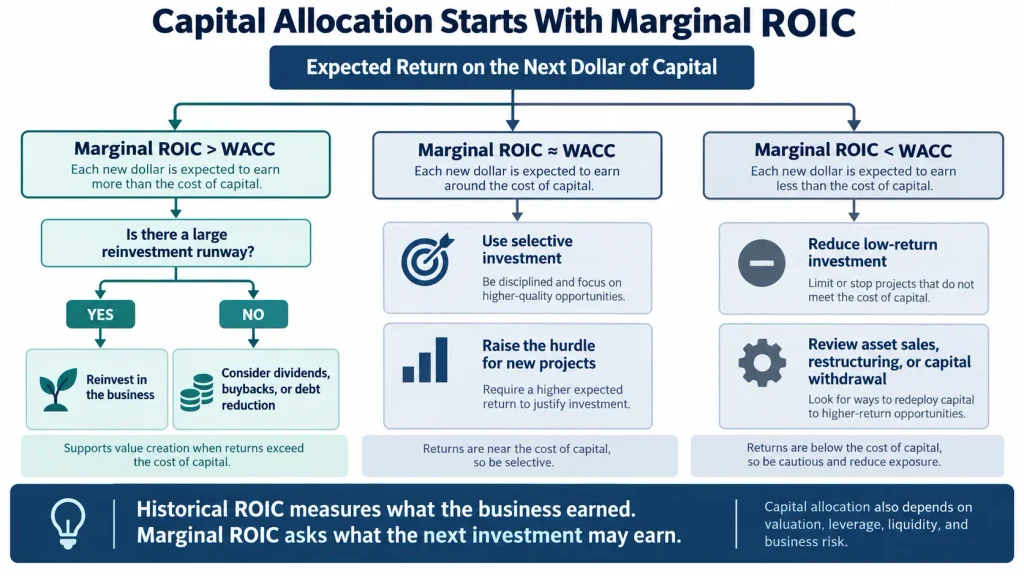
Capital allocation depends on the expected return on the next dollar invested, not only the company’s historical ROIC. A business with a positive spread may favor reinvestment when attractive opportunities remain, while a shrinking spread can make distributions, debt reduction, or lower reinvestment more rational.
Why WACC Is a Moving Hurdle Rate
ROIC comes primarily from company operating results and balance-sheet inputs. WACC combines company-specific financing costs with market assumptions, which makes it inherently more sensitive to the financial environment.
A standard WACC formulation is:
WACC = E ÷ (D + E) × Ke + D ÷ (D + E) × Kd × (1 − T)
- E: market value of equity
- D: value of interest-bearing debt
- Ke: cost of equity
- Kd: pre-tax cost of debt
- T: applicable tax rate
The debt portion is usually adjusted for the tax effect of interest expense. The equity portion is more difficult because shareholders do not send a company an invoice showing their required return.
A common approach to estimating the cost of equity is the Capital Asset Pricing Model:
Cost of Equity = Risk-Free Rate + Beta × Equity Risk Premium
For a U.S. dollar analysis, investors can use a current Treasury yield as one reference point for the risk-free rate. The 10-Year Treasury Constant Maturity series from FRED is one readily accessible source. The appropriate risk-free benchmark can vary with the valuation framework and cash-flow duration.
The equity risk premium is also an estimate rather than a fixed accounting value. Aswath Damodaran’s NYU Stern valuation resources publish equity risk premium and cost-of-capital data with methodology and update dates.
A Simple WACC Example
Assume a hypothetical company is financed with 80% equity and 20% debt. The estimated cost of equity is 9%, the pre-tax cost of debt is 5%, and the tax rate is 25%.
WACC = 80% × 9% + 20% × 5% × (1 − 25%)
WACC = 7.20% + 0.75% = 7.95%
Rounding that estimate gives a hurdle rate of about 8%.
The important word is estimate. A different beta window, equity risk premium, borrowing cost, capital structure, or risk-free rate can produce a different WACC. Investors should be cautious about treating 7.93% and 8.07% as meaningfully different levels of economic reality.
A Practical ROIC vs WACC Research Process
Investors do not need to accept a financial website’s finished ROIC or WACC number without examining the assumptions behind it. A repeatable process makes comparisons more useful.
1. Build NOPAT From Operating Results
Start with operating income and the relevant tax assumptions rather than net income, which is affected by interest expense and capital structure.
U.S. public-company financial statements and filing notes can be reviewed through the SEC EDGAR filing database.
2. Define Invested Capital Consistently
ROIC definitions can differ across data providers. One common approach begins with book debt and book equity, then subtracts cash and other non-operating assets.
Consistency matters more than choosing a denominator because it produces the highest-looking ROIC. When analyzing trends, use the same method across periods and consider average invested capital so the balance-sheet period better matches the earnings period.
3. Document the WACC Assumptions
Record the risk-free rate, beta, equity risk premium, cost of debt, tax rate, and market-value capital weights used in the estimate.
If two analysts calculate different WACCs for the same company, the disagreement may come from assumptions rather than arithmetic.
4. Compare Multiple Years, Not One Snapshot
A single-year ROIC can be influenced by a cyclical profit peak, asset sale, impairment, acquisition, unusual tax item, or a sharp movement in working capital.
A persistent positive spread across different business conditions is more informative than one unusually strong year.
5. Separate Historical ROIC From the Return on New Capital
This is especially important for companies entering a new investment cycle. A software business with an excellent legacy return profile may earn a very different return on billions of dollars spent on new infrastructure or acquisitions.
For capital-allocation analysis, the economics of incremental investment can matter more than the historical average.
How ROIC vs WACC Connects to Free Cash Flow and DCF
ROIC, WACC, free cash flow, and discounted cash flow answer different questions, but they fit together naturally.
ROIC: What return is the operating business generating on invested capital?
WACC: What return do debt and equity capital providers require?
Free Cash Flow: How much cash remains after operating needs and capital spending?
DCF: What are expected future cash flows worth today after discounting them for risk and time?
This connection helps explain why falling free cash flow is not always evidence of deteriorating economics.
A company may increase capital expenditures to build factories, distribution capacity, or computing infrastructure. Current free cash flow can fall immediately because the cash is being spent now, while the future economic return on that investment has not yet appeared.
The analytical question becomes: Is that additional capital likely to earn a return above the company’s cost of capital?
For a closer look at the cash-flow side, the Smart Asset Desk free cash flow guide explains how operating cash flow and capital expenditures interact.
WACC also appears directly in valuation. A DCF model discounts expected future cash flows back to present value using a discount rate that reflects risk. The DCF model for beginners shows how changes in the discount rate can materially change a valuation result.
Five Common ROIC vs WACC Mistakes
Treating WACC as an Exact Number
WACC is built from estimates. A small difference between ROIC and WACC may disappear when reasonable assumptions change. A wide and persistent spread is more informative than false decimal-point precision.
Ignoring Goodwill and Acquisition Accounting
Large acquisitions can add substantial goodwill and intangible assets to invested capital. Different treatments of those items can produce materially different ROIC figures for the same company.
Historical impairments can create the opposite problem by reducing the accounting capital base and making later ROIC appear unusually high.
Applying the Same Framework to Banks and Insurers
Debt is an operating input for banks, insurers, and many other financial institutions. Traditional industrial-company invested-capital calculations can therefore be less informative for these businesses.
Sector-specific metrics such as ROE, tangible equity returns, capital ratios, credit quality, and net interest economics may be more appropriate.
Assuming a High Historical ROIC Guarantees a Long Growth Runway
A business can earn a 25% or 30% ROIC on its existing operations yet have very little room to reinvest additional capital at comparable returns.
High returns become much more powerful when they are combined with a long runway for reinvestment.
Confusing a Great Business With a Cheap Stock
ROIC evaluates business economics. It does not tell investors whether the stock is attractively valued.
A company can create substantial economic value internally and still deliver disappointing shareholder returns if investors pay a price that already assumes exceptional future growth.
What Investors Should Take Away
ROIC becomes far more useful when it is measured against the company’s estimated cost of capital rather than judged against an arbitrary percentage threshold.
A positive ROIC–WACC spread suggests that the current operating capital base is earning more than its estimated hurdle rate. The next question is whether management can continue deploying additional capital at similarly attractive returns.
That progression creates a useful chain of analysis:
- Measure the return generated by the operating capital base.
- Estimate the cost of the debt and equity financing supporting that capital.
- Calculate the ROIC–WACC spread.
- Translate the spread into approximate economic profit when useful.
- Evaluate the expected return on new capital rather than relying only on historical ROIC.
- Compare reinvestment with dividends, buybacks, debt reduction, asset sales, or lower reinvestment.
- Cross-check the result against free cash flow and valuation.
The strongest capital-allocation story is not simply a company with a high ROIC. It is a company that can repeatedly invest meaningful amounts of incremental capital at returns comfortably above its cost of capital. For investors, that business quality still has to be weighed against the price paid for the stock.
FAQ
Can a company create value with a relatively low ROIC?
Yes. ROIC should be evaluated relative to the company’s cost of capital rather than against one universal percentage. A 9% ROIC can still represent a positive economic spread if WACC is 6%, while a 12% ROIC may be inadequate for a company whose cost of capital is 13%.
Should investors focus on historical ROIC or incremental ROIC?
Both can be useful, but they answer different questions. Historical ROIC shows how the existing business has performed. Incremental or marginal ROIC is more relevant when evaluating whether new investment is likely to create value. A company with excellent legacy economics can still allocate new capital poorly.
Can free cash flow fall while the company is still creating value?
Yes. Free cash flow may decline when a company increases capital spending on projects that could generate attractive future returns. The important distinction is whether the spending is likely to earn a return above the cost of capital. If large investments repeatedly produce returns below WACC, lower free cash flow becomes more concerning.
Investment Disclaimer: This article is for educational and research purposes only and is not a recommendation to buy or sell any security. ROIC and WACC can vary based on accounting definitions and valuation assumptions, and financial data may change over time. Investors are responsible for their own investment decisions and outcomes.