NVIDIA RSI Oversold Strategy: Signals, Risks, and Price Trends
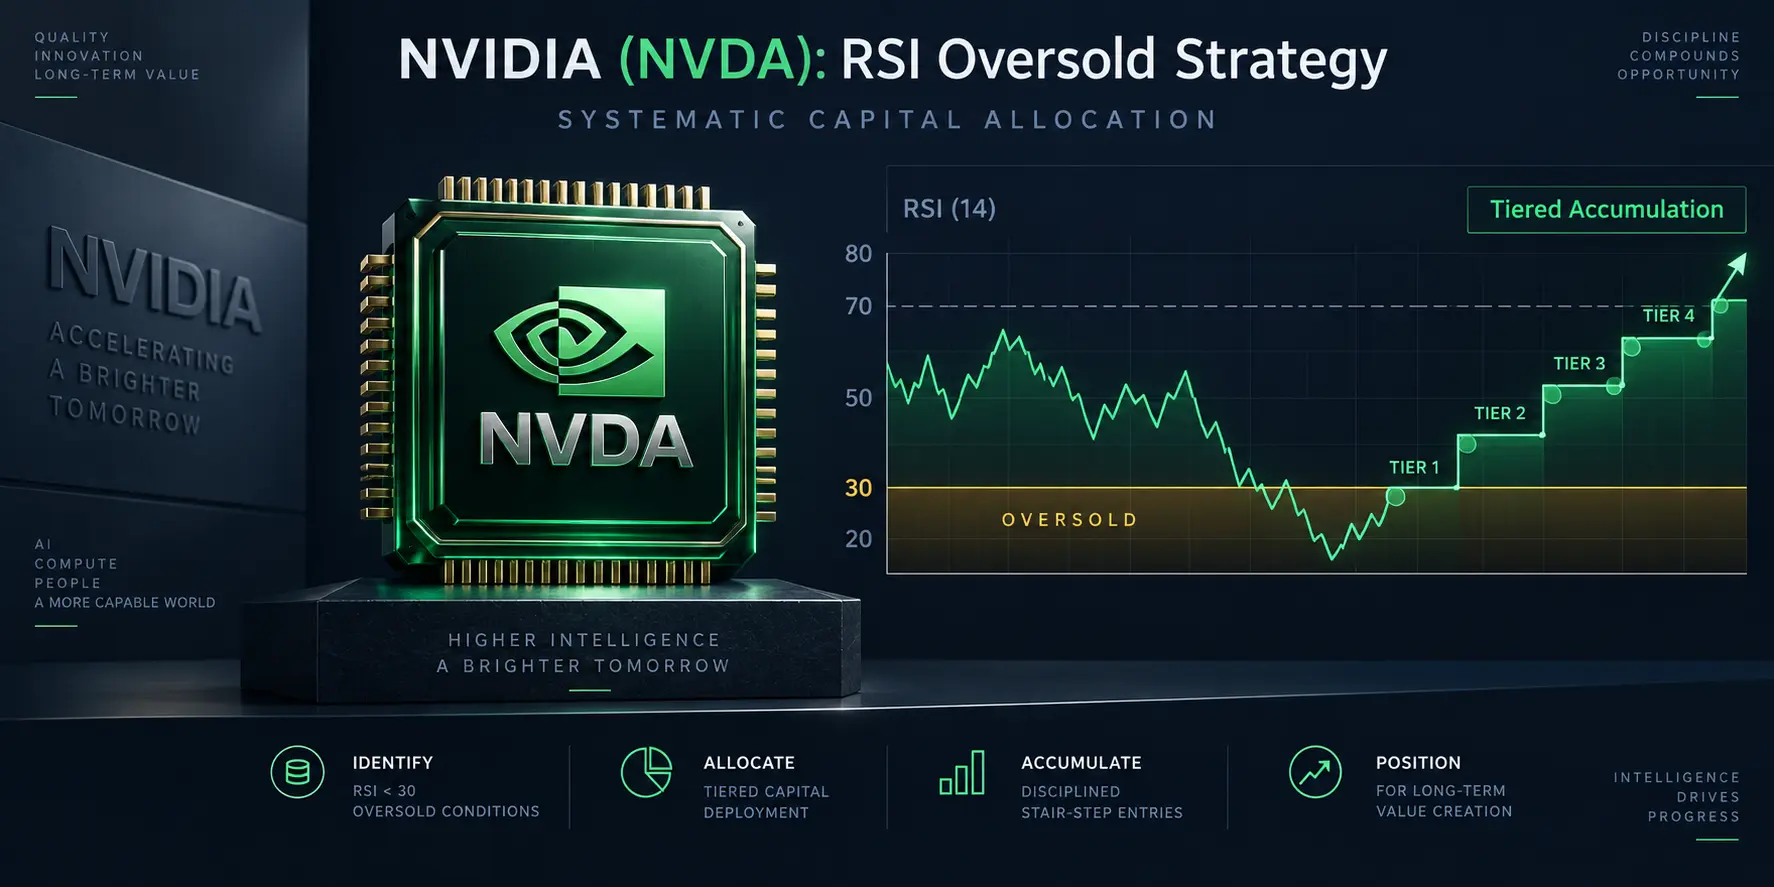
NVIDIA NVDA RSI oversold strategy showing systematic accumulation bands and long-term support metrics

An RSI reading below 30 can draw attention to NVIDIA (NVDA) after a substantial stock-price decline. It does not establish that the stock is undervalued, that selling has ended, or that a recovery is imminent. A useful NVIDIA RSI oversold strategy treats the Relative Strength Index as a momentum indicator, not an automatic purchase instruction. … Read more

Broadcom 200 Day Moving Average: Trend, RSI, and FCF

Broadcom 200 day moving average trendline floor and technical momentum reversal overview

The Broadcom 200 day moving average can help investors evaluate the longer-term direction of AVGO stock, but it cannot establish a guaranteed support price or determine whether the shares are undervalued. A useful Broadcom 200 day moving average analysis combines price trends, RSI momentum, and the company’s operating performance without treating any one indicator as … Read more

McDonald’s Accumulation Strategy: Critical Fair Value and 3-Tranche Plan (2026)

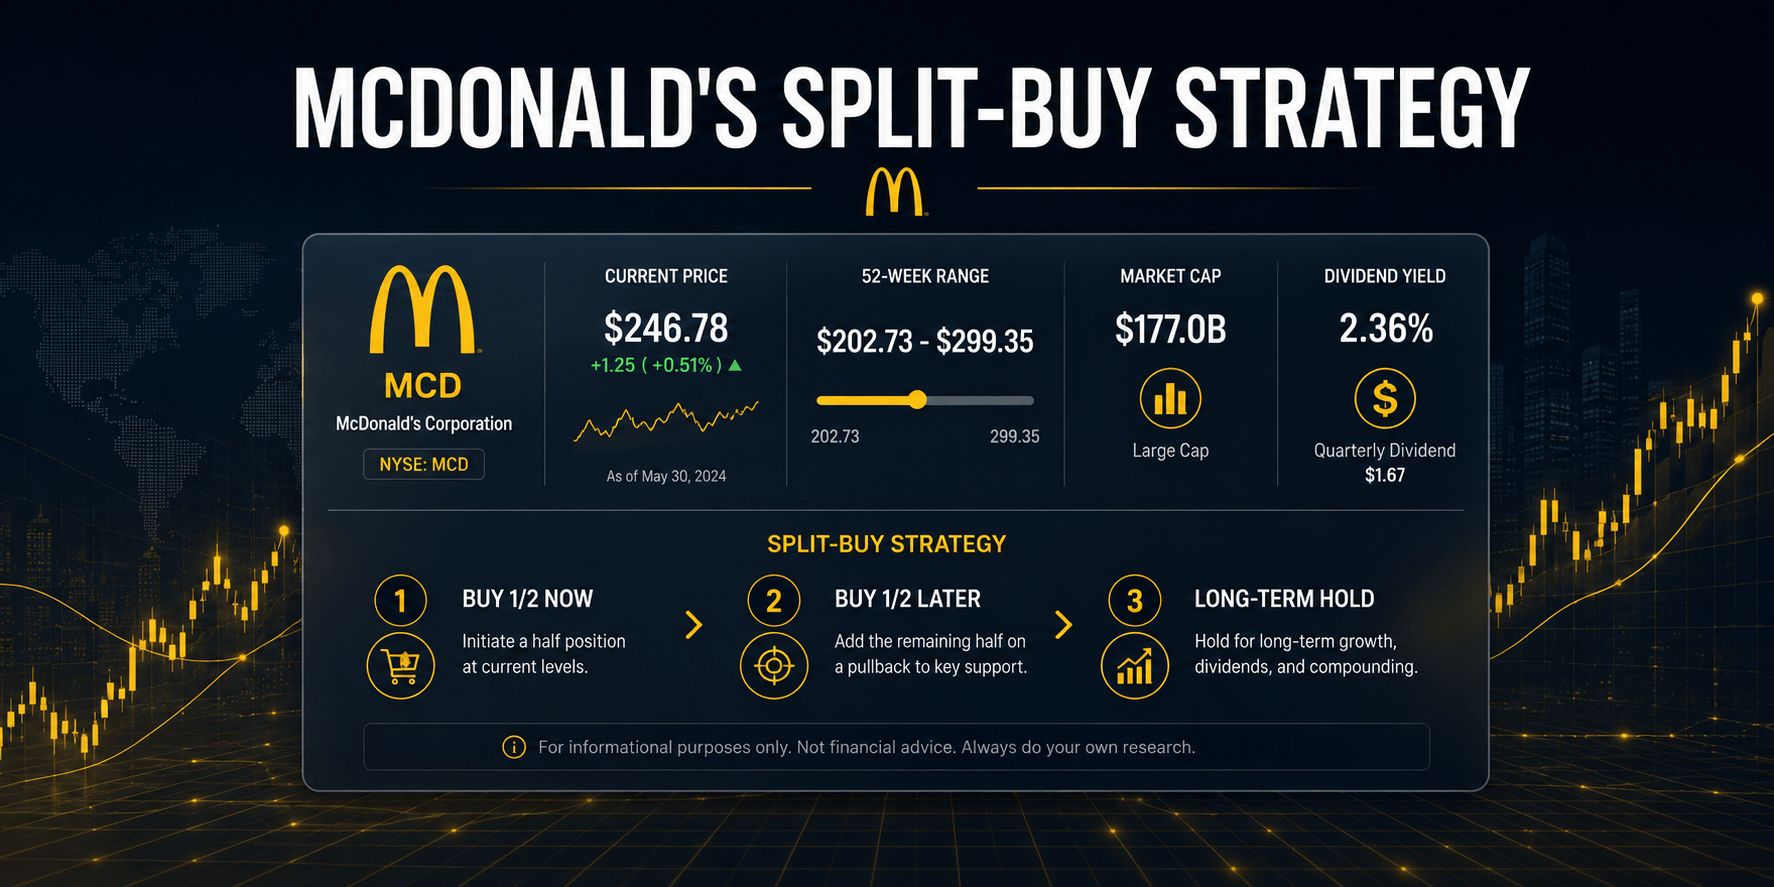
McDonald's accumulation strategy showing chart rebounds and valuation metrics

Deploying a structured McDonald’s accumulation strategy enables dividend growth investors to systematically navigate pullbacks, mitigating emotional drawdowns while steadily locking in superior distribution yields. When managing premium dividend franchises, broad market consolidations offer prime opportunities to lower cost baselines rather than triggering panic exits. Consequently, with the live portfolio recording a temporary unrealized drawdown of … Read more

Lockheed Martin Stock Support Levels: F-35 Risks and Key LMT Price Zones

Lockheed Martin stock support levels technical analysis and valuation outlook

Lockheed Martin stock support levels came into focus after LMT traded above $600 in mid-August 2026 and closed at $531.55 on September 2. The stock subsequently tested the low-$520s before recovering to $537.25 at the September 16 close. That price action keeps the $528–$532 area and the deeper $518–$521 area relevant as technical reference zones, … Read more