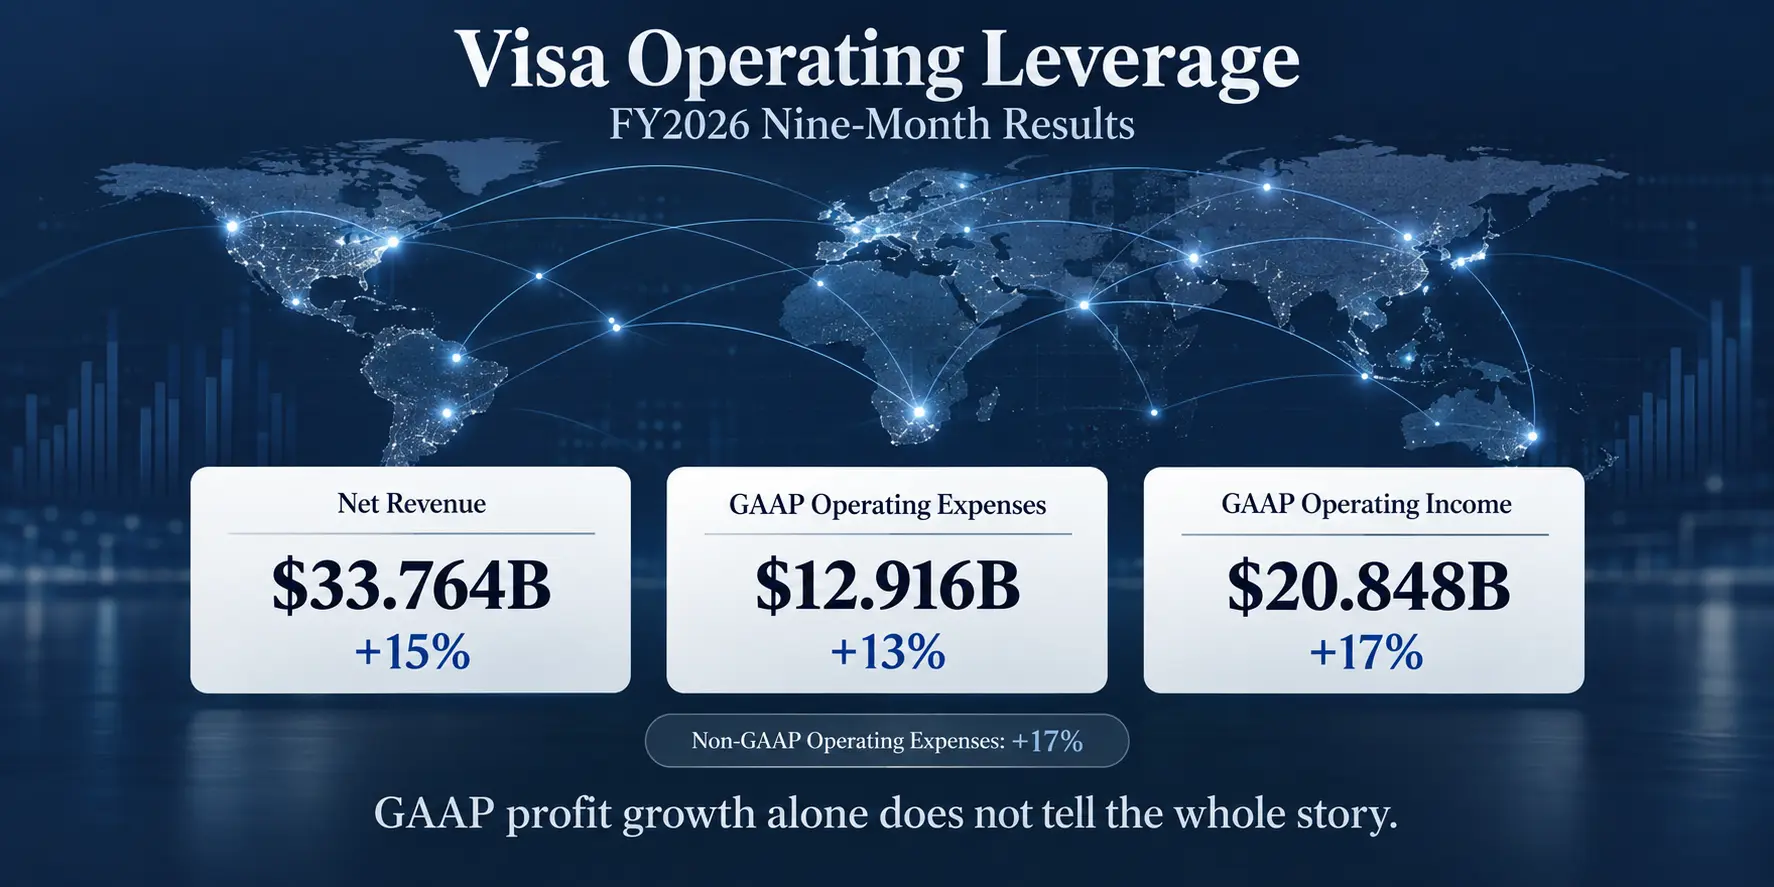
Visa operating leverage looks positive at first glance in the company’s FY2026 results. For the nine months ended June 30, 2026, net revenue increased 15%, GAAP operating expenses rose 13%, and operating income grew about 17%.
That combination normally points to positive operating leverage: revenue is expanding faster than the operating cost base, allowing a larger share of incremental sales to reach operating profit.
But Visa’s numbers become more complicated once the expense mix is examined. Non-GAAP operating expenses increased 17% over the same nine-month period, the litigation provision declined sharply, and the third quarter by itself showed operating expenses growing faster than revenue.
The most useful conclusion is not simply that Visa showed positive operating leverage. The nine-month GAAP results did show margin expansion, but adjusted expenses and the Q3 cost trend suggest investors should separate recurring business economics from period-specific accounting and expense effects.
Visa is especially interesting for this analysis because it operates a global payment network rather than lending directly to cardholders. A network business can benefit from scale as transaction activity grows, but that does not mean every period of faster profit growth is automatically the result of fixed-cost leverage.
For a refresher on the underlying concept, see Operating Leverage Explained: Why Profit Can Grow Faster Than Revenue.
Visa Operating Leverage: The Nine-Month GAAP Picture
Visa reported $33.764 billion of net revenue for the nine months ended June 30, 2026, compared with $29.276 billion in the prior-year period. That represents 15% year-over-year growth.
GAAP operating expenses increased from $11.430 billion to $12.916 billion, or 13%. Operating income rose from $17.846 billion to $20.848 billion, an increase of about 17%.
| Metric | FY2025 Nine Months | FY2026 Nine Months | Change |
|---|---|---|---|
| Net revenue | $29.276B | $33.764B | +15% |
| GAAP operating expenses | $11.430B | $12.916B | +13% |
| GAAP operating income | $17.846B | $20.848B | About +17% |
| GAAP operating margin | About 61.0% | About 61.7% | About +0.8 pp |
| Non-GAAP operating expenses | $9.295B | $10.868B | +17% |
| Processed transactions | 189.891B | 207.148B | +9% |
The figures above are based on Visa’s FY2026 third-quarter Form 10-Q. Visa notes that reported percentage changes are calculated from unrounded figures, so displayed values may not always recalculate exactly from rounded amounts.
Using the reported revenue and operating-income figures, GAAP operating margin increased from about 61.0% to 61.7%. That is an improvement of roughly 0.8 percentage points.
On this basis, the operating-leverage signal is clear: revenue grew faster than operating expenses, and operating profit grew faster than revenue.

This comparison shows net revenue rising faster than operating expenses, lifting operating margin from about 61.0% to 61.7%. The roughly 0.8-percentage-point improvement is the headline signal, but it does not isolate the underlying expense mix.
Why Visa Operating Leverage Needs a Second Look
The key complication is Visa’s litigation provision.
For the nine-month period, litigation provision declined from $1.659 billion in FY2025 to $1.290 billion in FY2026, a 22% decrease. In the third quarter alone, it declined from $615 million to $253 million, or 59%.
Visa explains in its filing that litigation provisions associated with certain legal matters can vary significantly based on the facts and circumstances of each case and do not correlate with the underlying performance of the business. The company therefore excludes certain litigation amounts when presenting its non-GAAP measures.
This matters because a lower litigation provision can help hold down reported GAAP operating-expense growth even if other operating costs are increasing faster.
That is exactly why the non-GAAP comparison adds useful context. Visa’s non-GAAP operating expenses increased from $9.295 billion to $10.868 billion during the nine-month period, a 17% increase.
Net revenue, meanwhile, increased 15%.
Net revenue growth: +15% vs. non-GAAP operating expense growth: +17%
For investors assessing Visa operating leverage, the adjusted expense trend is less favorable than the GAAP income statement alone suggests.
This does not mean non-GAAP figures are automatically more meaningful than GAAP results. These measures reflect company-defined adjustments, and Visa states that they should not be relied upon as substitutes for, or considered in isolation from, GAAP measures. The useful approach is to review both and understand why they differ.
Other expenses also deserve attention. Over the nine-month period, personnel expense increased 16% and marketing expense increased 45%. Those increases help explain why the underlying cost picture was more demanding than the headline GAAP expense growth rate suggests.
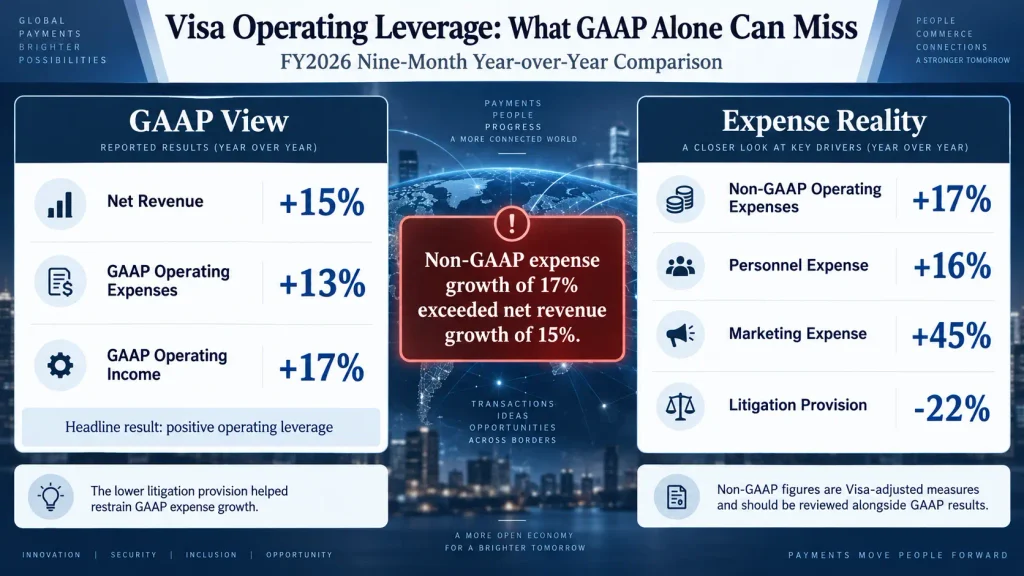
The adjusted expense picture is less favorable than the headline GAAP comparison. Non-GAAP operating expenses increased 17%, faster than 15% net revenue growth, while the litigation provision declined 22%; personnel and marketing expenses also rose materially.
Q3 Shows the Other Side of Operating Leverage
The third quarter by itself provides an important counterexample to the nine-month GAAP trend.
| Metric | FY2025 Q3 | FY2026 Q3 | Change |
|---|---|---|---|
| Net revenue | $10.172B | $11.633B | +14% |
| GAAP operating expenses | $3.995B | $4.756B | +19% |
| GAAP operating income | $6.177B | $6.877B | About +11% |
| GAAP operating margin | About 60.7% | About 59.1% | About -1.6 pp |
| Non-GAAP operating expenses | $3.307B | $3.878B | +17% |
Revenue grew 14%, but GAAP operating expenses increased 19%. Operating income rose only about 11%, and operating margin fell from approximately 60.7% to 59.1%.
Personnel expense increased from $1.749 billion to $2.458 billion, or 40%. Marketing expense increased from $421 million to $649 million, or 54%.
Visa’s non-GAAP reconciliation also excluded $563 million of Q3 severance costs. The filing says those costs resulted from actions intended to improve operating efficiency and reinvest in higher-growth opportunities.
The broader lesson is important: operating leverage is not a permanent label attached to a company. The same business can show positive leverage over one period and negative leverage over another depending on revenue growth, expense timing, restructuring, litigation, and other cost movements.
What Is Actually Driving Visa’s Revenue Growth?
Expense analysis is only half of the equation. Sustainable operating leverage requires a healthy revenue engine.
Visa identifies payments volume, processed transactions, cross-border activity, pricing, and value-added services among the factors influencing revenue.
FY2026 Q3 processed transactions reached 71.662 billion, up 10% year over year. For the nine-month period, processed transactions increased 9% to 207.148 billion from 189.891 billion.
For the periods used to assess service revenue—the three and nine months ended March 31, 2026—nominal payments volume increased 11% and 10%, respectively. Nominal cross-border volume excluding transactions within Europe increased 14% in Q3 and 15% over the nine months ended June 30, 2026.
Those operating metrics help explain the revenue growth, but client incentives work in the opposite direction. Client incentives increased 18% in Q3 and 15% during the nine-month period, partially offsetting gross revenue growth.
This is why headline revenue growth should be broken into its underlying drivers. The Smart Asset Desk guide How to Analyze Revenue Growth: Price vs. Volume vs. Mix explains how to separate the components behind top-line growth. For Visa, transaction counts, payment volume, cross-border activity, pricing, and incentives serve as more relevant industry-specific operating drivers than simple unit sales.
Value-added services are becoming more important
Visa also generates a growing amount of revenue from services beyond basic payment processing.
Value-added services revenue reached $3.8 billion in FY2026 Q3, up 33% from $2.8 billion a year earlier. For the nine-month period, it increased 32% from $7.8 billion to $10.3 billion.
Visa attributed that growth to underlying business drivers including consulting and marketing engagements, processed transactions, the number and mix of payment credentials, and pricing.
That creates another layer for operating-leverage analysis. Future margin performance will depend not only on payment-network scale, but also on how quickly the company must expand personnel, marketing, technology, and other costs to support its broader service portfolio.
Why Cash Flow Did Not Follow Operating Income
Operating income increased about 17% over the nine-month period, but operating cash flow moved in the opposite direction.
Net cash provided by operating activities declined from $16.821 billion to $16.342 billion, a decrease of about 2.8%.
Visa attributed the decline primarily to higher litigation payments, higher incentive payments, and the timing of income-tax payments, partially offset by growth in the underlying business.
Purchases of property, equipment and technology increased from $1.093 billion to $1.178 billion.
A simple reference calculation subtracting those purchases from operating cash flow produces approximately $15.728 billion for FY2025 and $15.164 billion for FY2026, a decline of roughly 3.6%.
This calculation should not be confused with an official Visa non-GAAP free-cash-flow measure. It is simply a consistent way to compare operating cash generation after the disclosed property, equipment and technology purchases.
The difference illustrates why income-statement operating leverage should not be analyzed in isolation. Investors can continue the analysis with How to Calculate Free Cash Flow Margin, which explains how operating cash flow and capital expenditures affect cash conversion.
A Better Checklist for Analyzing Visa Operating Leverage
1. Track the revenue engine.
Watch payments volume, processed transactions, cross-border volume, value-added services and client incentives rather than relying only on reported revenue growth.
2. Compare GAAP and adjusted expense growth.
GAAP expenses show the complete accounting result, while the non-GAAP reconciliation can help identify how litigation, severance and other adjusted items affect period-to-period comparisons.
3. Watch personnel and marketing costs.
These expenses grew quickly in FY2026 and can offset the benefits of transaction scale if they continue to outpace revenue.
4. Check quarterly results as well as year-to-date figures.
The nine-month GAAP results showed margin expansion, while Q3 alone showed margin contraction. A cumulative figure can hide changes in the most recent quarter.
5. Follow the cash conversion.
Faster operating-income growth becomes more economically meaningful when operating cash flow and free cash flow eventually confirm the improvement.
The Bottom Line
Visa’s business model has characteristics that can support operating leverage as transaction volume scales. Its global network processes enormous transaction volumes, and the FY2026 nine-month GAAP income statement showed revenue rising faster than operating expenses.
But the quality of that margin expansion matters.
The lower litigation provision helped restrain GAAP expense growth. Non-GAAP operating expenses rose 17%, faster than the 15% increase in net revenue. Q3 also showed the opposite of positive leverage, with operating expenses growing faster than revenue and operating margin declining.
For that reason, the best interpretation of the current data is more measured: Visa showed positive operating leverage on a nine-month GAAP basis, but the adjusted expense trend and Q3 results do not yet establish a clear, broad-based acceleration in underlying operating leverage. In other words, the current Visa operating leverage evidence is positive on a cumulative GAAP basis but mixed once adjusted costs and the latest quarter are considered.
The next earnings reports should therefore be evaluated across several layers: revenue drivers, GAAP expenses, adjusted expenses, operating margin and cash conversion. That sequence provides a more useful picture than treating one period of faster profit growth as proof of permanently stronger economics.
Frequently Asked Questions
What does Visa operating leverage show in FY2026?
Visa’s payment-network model can benefit from scale because additional transaction activity can use existing network infrastructure. However, the actual degree of operating leverage changes over time. FY2026 nine-month GAAP results showed positive leverage, while adjusted expenses and the third-quarter result showed stronger cost pressure.
Should investors use GAAP or non-GAAP expenses when analyzing Visa?
Both provide useful but different information. GAAP captures the full accounting result, while Visa’s non-GAAP measures remove selected items that management believes can distort comparisons of ongoing performance. Non-GAAP figures should be reviewed alongside GAAP results rather than treated as replacements for them.
What should investors watch in Visa’s next earnings report?
Start with net revenue growth versus GAAP and non-GAAP operating-expense growth. Then review payments volume, processed transactions, cross-border volume, value-added services, personnel costs, marketing expense and operating cash flow to determine whether improving scale is translating into broader margin and cash-flow expansion.
Investment Disclaimer
This article is for educational and investment-research purposes only and is based on publicly available company filings and financial information. It is not a recommendation to buy or sell Visa or any other security. Financial results, operating costs and business conditions can change in future reporting periods. Investors should review the latest company filings and conduct their own research before making investment decisions.