
Revenue growth and operating profit growth often move at very different speeds. A company might report a 10% increase in sales while operating profit rises 20%, 30%, or even more. One of the most useful concepts for understanding that gap is operating leverage.
Operating leverage describes how a company’s cost structure can amplify the effect of changing revenue on operating profit. The basic idea is straightforward: variable costs tend to move with business activity, while some fixed costs do not change nearly as quickly. Once those fixed costs are covered, additional revenue can have a larger effect on operating income.
Operating leverage measures how sensitive operating profit is to changes in revenue. It can magnify profit growth when sales rise, but the same cost structure can also magnify profit declines when sales fall.
What Is Operating Leverage?
Operating leverage comes from the relationship between revenue, variable costs, and fixed operating costs.
A simplified operating-profit equation is:
Operating Profit = Revenue − Variable Costs − Fixed Costs
Variable costs typically rise or fall as production, transactions, shipments, or sales activity changes. Fixed costs behave differently over the relevant period. Rent, depreciation, certain salaried labor, and some infrastructure-related operating expenses may not change immediately when revenue moves.
If sales increase while fixed costs remain relatively stable, more of each additional revenue dollar can reach operating profit. That is the source of the amplification investors are trying to measure.
| Metric | What It Represents | What Investors Should Ask |
|---|---|---|
| Revenue | Sales generated by the business | What is driving the growth? |
| Variable Costs | Costs that tend to change with business activity | How much incremental cost comes with new revenue? |
| Fixed Costs | Costs that do not immediately move with revenue | How much cost remains even if sales slow? |
| Operating Profit | Profit after operating costs | Is profit changing faster than revenue? |
| DOL | Degree of operating leverage | How sensitive is operating profit to sales changes? |
Before interpreting that amplification, start with the top line. Investors first need to know what is actually driving revenue growth—price, volume, mix, currency, acquisitions, or some combination of those factors.
A Simple Operating Leverage Example
Consider a hypothetical business with the following cost structure:
Revenue = 100
Variable Costs = 60
Fixed Costs = 30
Operating profit is therefore:
100 − 60 − 30 = 10
Now assume revenue increases 10% from 100 to 110. For this simplified example, the variable-cost ratio remains 60%, so variable costs increase from 60 to 66. Fixed costs remain at 30.
The new operating profit becomes:
110 − 66 − 30 = 14
Revenue increased by 10%, but operating profit increased from 10 to 14, which is a 40% increase.
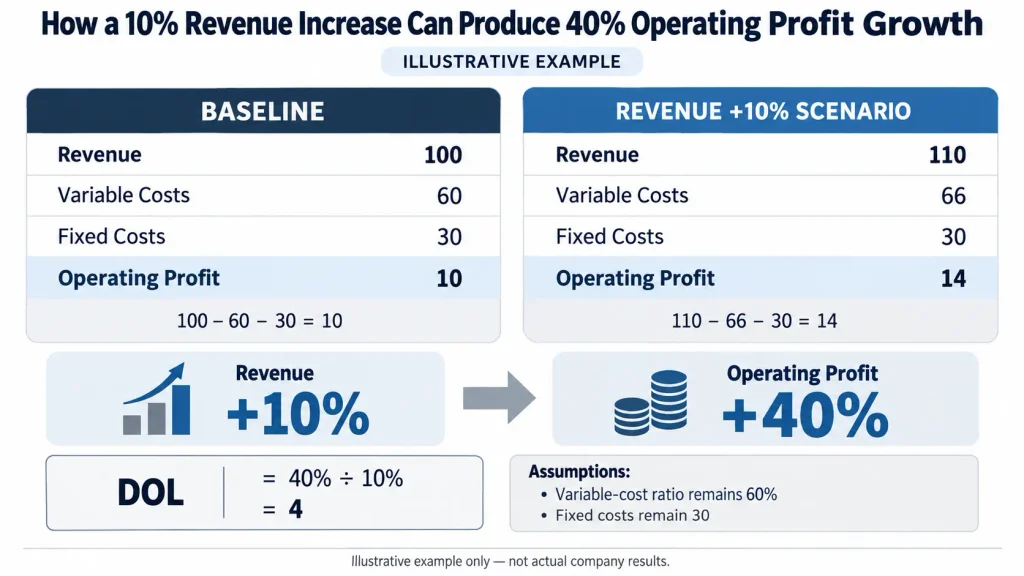
Illustrative example: with a 60% variable-cost ratio and fixed costs held at 30, a 10% increase in revenue from 100 to 110 increases operating profit from 10 to 14, or 40%. These figures are hypothetical, not actual company results.
| Item | Baseline | After 10% Revenue Growth | Change |
|---|---|---|---|
| Revenue | 100 | 110 | +10% |
| Variable Costs | 60 | 66 | +10% |
| Fixed Costs | 30 | 30 | 0% |
| Operating Profit | 10 | 14 | +40% |
The mechanism is easier to see when the incremental dollars are separated. Revenue increased by 10. Variable costs increased by 6. Fixed costs did not change, so the remaining 4 became additional operating profit.
Real businesses are more complicated. Selling prices, product mix, wages, marketing spending, depreciation, logistics, and other costs can all change at the same time. Faster operating-profit growth should therefore not be attributed to operating leverage automatically.
How to Calculate the Degree of Operating Leverage
The degree of operating leverage, or DOL, expresses operating-profit sensitivity numerically.
One common relationship is:
DOL = Percentage Change in Operating Profit ÷ Percentage Change in Revenue
In the example above:
DOL = 40% ÷ 10% = 4
Under those assumptions, a DOL of 4 means operating profit is highly sensitive to changes in revenue around that sales level.
When a company’s cost structure is known in enough detail, DOL can also be calculated using contribution margin:
DOL = Contribution Margin ÷ Operating Profit
Contribution margin in the baseline example is:
100 − 60 = 40
Operating profit is 10, so:
40 ÷ 10 = 4
The two methods produce the same result in this simplified example. OpenStax’s managerial accounting discussion of operating leverage likewise connects DOL to contribution margin and operating income.
DOL is not a permanent characteristic that can be attached to a company forever. It changes with the level of revenue, contribution margin, fixed costs, and operating profit.
Near break-even, the math can become extreme. When operating profit is very small, percentage changes in profit can become very large. At the exact break-even point, operating profit is zero, so the contribution-margin-divided-by-operating-profit version of DOL is undefined.
Operating Leverage Works in Both Directions
Operating leverage is often framed as an earnings-upside story, but the same mechanics apply when revenue falls.
Return to the same hypothetical company and assume revenue falls 10%, from 100 to 90. If the variable-cost ratio remains 60%, variable costs fall to 54 while fixed costs remain 30.
Operating profit becomes:
90 − 54 − 30 = 6
Revenue declined 10%, but operating profit declined from 10 to 6, a 40% decrease.
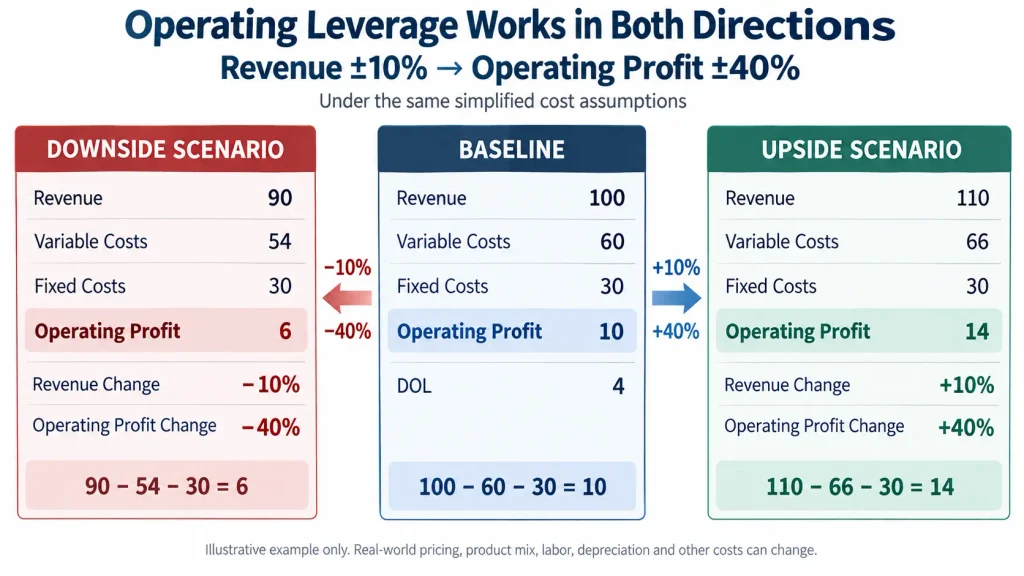
Illustrative example: under the same 60% variable-cost ratio and fixed-cost assumption, a 10% revenue move produces a 40% operating-profit move in either direction. Actual businesses rarely hold every cost and pricing assumption constant.
This downside sensitivity is why a high-fixed-cost business can look exceptionally profitable when utilization and demand are rising, yet experience much sharper earnings pressure when revenue weakens.
Distance from break-even therefore deserves attention; a high DOL is not automatically attractive.
High Operating Leverage Is Not Automatically Good or Bad
A business with significant manufacturing capacity, telecom infrastructure, data centers, software development costs, or other large upfront commitments may have substantial costs that do not immediately change with sales.
If the company can increase revenue without adding those costs at the same rate, operating margin can expand quickly. But if demand weakens, management may not be able to reduce the same expenses just as quickly.
A more variable-cost-heavy business can behave differently. Outsourcing, transaction-based fees, commissions, and other activity-linked expenses may rise as revenue rises, limiting upside operating leverage. The same flexibility, however, may allow some costs to decline more readily during a slowdown.
A more informative question is: “How does this cost structure transmit changes in revenue into changes in operating profit?”
How Investors Can Identify Operating Leverage in Earnings
Public-company disclosures rarely separate every expense neatly into fixed and variable categories. That makes precise DOL calculations difficult for outside investors. A practical earnings-analysis process can still reveal whether operating leverage appears to be strengthening or weakening.
1. Start with the revenue driver.
Determine whether sales growth came from price, volume, mix, currency, acquisitions, or another factor. The sustainability of operating leverage depends partly on whether the underlying revenue growth can continue.
2. Check gross margin.
If revenue is growing while gross margin deteriorates sharply, rising input costs or unfavorable product mix may absorb much of the potential operating leverage. Our guide to analyzing gross margin explains how price, volume, cost, and mix can affect this step.
3. Compare operating-expense growth with gross profit growth.
If gross profit expands faster than selling, general and administrative expense, research and development, or other relatively fixed operating costs, operating margin may improve.
4. Follow the result into cash flow.
Accounting operating profit and cash generation are not the same thing. Working capital and capital expenditures can produce a very different free-cash-flow outcome, which is why free cash flow margin is a useful next step.
For a real-world application of this process, see Visa Operating Leverage: What FY2026 Results Really Show. The analysis compares nine-month GAAP margin expansion with non-GAAP expense growth and the Q3 cost trend, showing why faster operating-profit growth should be decomposed before it is treated as durable operating leverage.
Operating Leverage Is Different From Operating Margin
Operating margin and operating leverage are related, but they answer different questions.
Operating Margin = Operating Profit ÷ Revenue × 100
Operating margin tells investors how much operating profit a company currently earns from each dollar of revenue. Operating leverage describes how sensitive that operating profit may be to changes in revenue.
A company can have a modest operating margin and still show a very large percentage increase in operating profit if it is moving away from break-even. Conversely, a highly profitable company can still have a lower DOL at a mature sales level than it had earlier in its growth cycle.
When an earnings headline shows operating profit up 50%, the percentage alone is not enough. Investors should also ask what happened to revenue, gross margin, operating expenses, and the prior-period profit base before concluding that the business developed stronger operating economics.
What Can Look Like Operating Leverage but Come From Something Else?
Operating profit can grow faster than revenue for reasons that have little to do with fixed-cost absorption.
- Pricing: Higher selling prices may improve gross margin.
- Product mix: A larger share of high-margin products or services may lift profitability.
- Lower input costs: Falling materials, freight, energy, or other costs can boost operating profit.
- Restructuring: Headcount reductions or organizational changes may lower operating expenses.
- Prior-period charges: The disappearance of a large one-time expense can create a favorable comparison.
- Accounting timing: Depreciation, impairment, and other expense recognition can affect period-to-period comparisons.
Operating leverage works best as an analytical lens rather than a standalone verdict. Investors still need to understand what changed inside the income statement.
A Better Way to Connect Revenue Growth to Cash Generation
Operating leverage becomes more useful when it is placed inside a broader fundamental-analysis sequence:
Revenue Growth → Price / Volume / Mix → Gross Margin → Operating Expenses → Operating Margin → Operating Cash Flow → Free Cash Flow
Start by identifying the source of sales growth. Then determine whether unit economics are improving. Next, examine whether operating expenses are scaling more slowly than gross profit. Finally, check whether higher accounting profit is converting into cash after working-capital needs and capital spending.
Used together, these steps help separate durable operating improvement from a quarter that benefited mainly from temporary pricing, cost relief, or an easy comparison.
Frequently Asked Questions
What Does High Operating Leverage Mean?
High operating leverage means operating profit is relatively sensitive to changes in revenue at the current sales and cost structure. It can produce faster profit growth when revenue rises, but it can also produce sharper profit declines when revenue falls. The effect depends on contribution margin, fixed costs, and how close the company is to break-even.
Can You Find Operating Leverage Directly on the Income Statement?
No. Companies do not normally report a line item called operating leverage. Investors generally have to examine revenue, gross profit, operating expenses, operating income, and management’s cost disclosures. Precise DOL calculations can be difficult when public filings do not clearly separate fixed and variable costs.
What Is the Difference Between Operating Leverage and Financial Leverage?
Operating leverage comes from the company’s operating cost structure, especially fixed operating costs. Financial leverage comes from financing choices such as debt and interest expense. A company can have both types of leverage at the same time, but they affect different stages of the income statement.
What Operating Leverage Tells Investors
Operating leverage explains why revenue and operating profit do not necessarily grow at the same rate. When fixed costs remain relatively stable while revenue rises, additional contribution can push operating profit higher at a faster percentage rate.
In the illustrative example used here, revenue rises from 100 to 110 while operating profit rises from 10 to 14. That translates to 10% revenue growth, 40% operating-profit growth, and a DOL of 4. Under the same simplified assumptions, a 10% decline in revenue reduces operating profit from 10 to 6, demonstrating the same leverage in the opposite direction.
High operating leverage is not a conclusion by itself. The analysis should determine what is driving revenue, how gross margin is changing, whether operating expenses are scaling efficiently, how far the business is from break-even, and whether stronger operating profit is ultimately turning into free cash flow.
Investment Disclaimer: This article is for educational and investment-research purposes only and is not a recommendation to buy or sell any security. Numerical examples are hypothetical and are intended to explain operating leverage rather than represent actual company results. Real businesses may experience changes in pricing, product mix, variable costs, fixed costs, capital spending, and other factors at the same time. Investors should review current company filings and financial disclosures before making investment decisions.