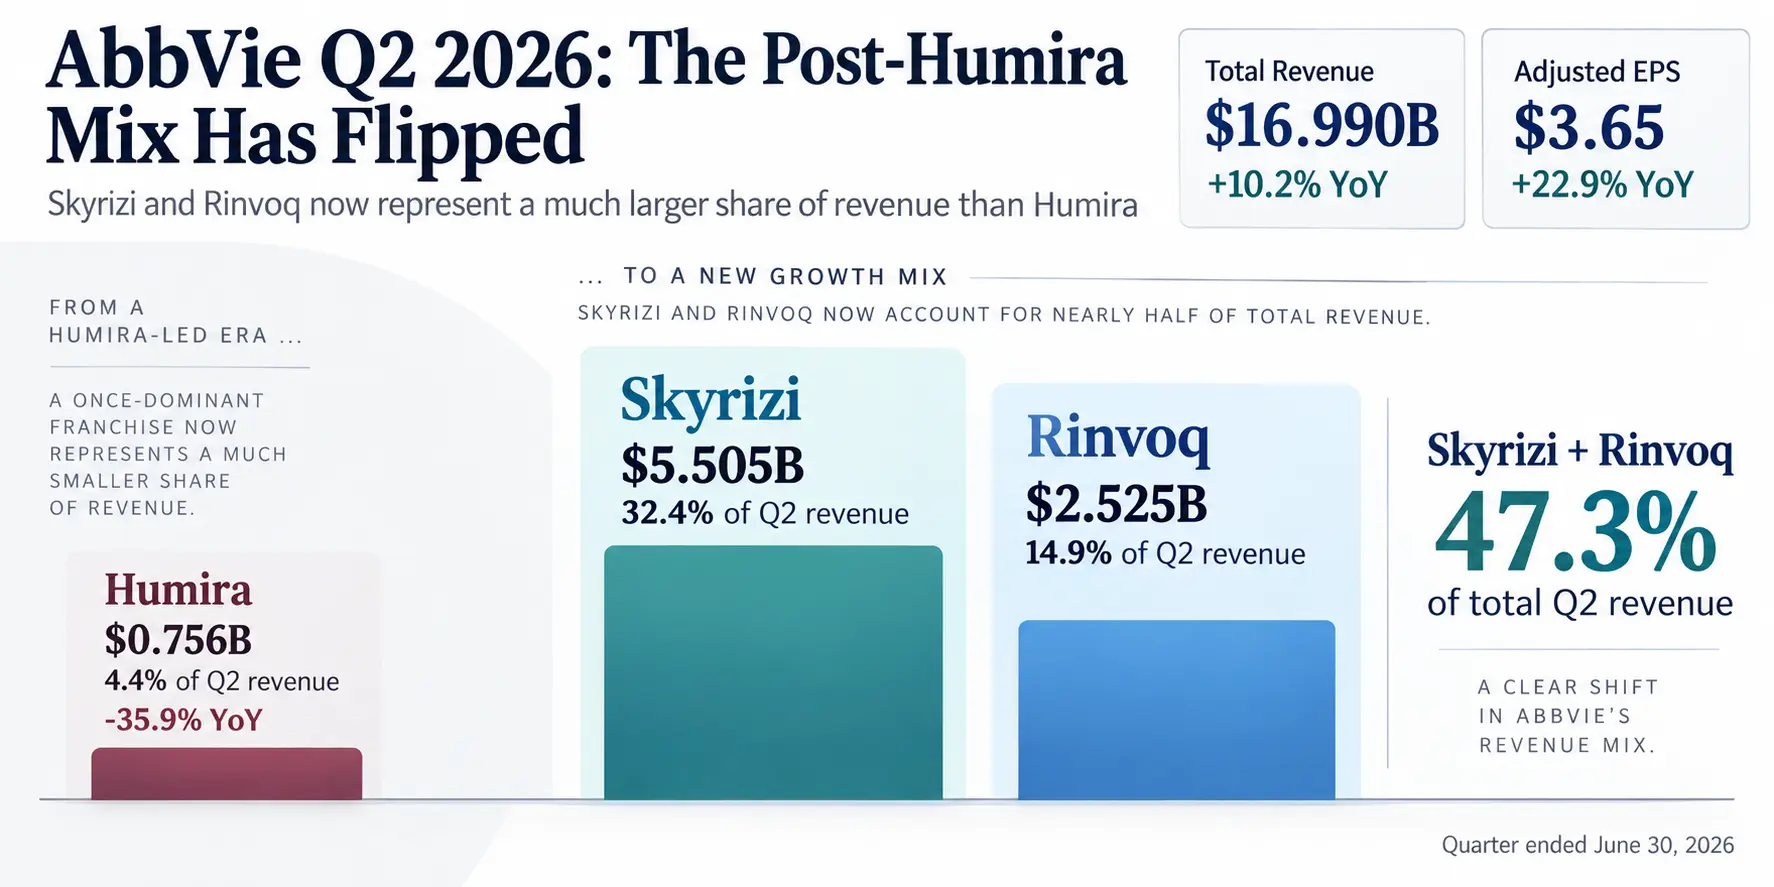
AbbVie earnings for Q2 2026 make the company’s post-Humira transition much easier to quantify. Revenue reached $16.990 billion, up 10.2% year over year on a reported basis, but the more revealing change is inside the product mix.
Skyrizi generated $5.505 billion of quarterly revenue and Rinvoq produced $2.525 billion. Together, those two products accounted for roughly 47.3% of AbbVie’s total Q2 revenue. Humira, once the company’s dominant franchise, contributed $756 million, or about 4.4% of total revenue.
The revenue mix has already changed more dramatically than the Humira headline suggests.
Skyrizi and Rinvoq added approximately $1.579 billion of revenue versus Q2 2025, while Humira declined by about $424 million. The two growth products therefore added roughly 3.7 times as much revenue as Humira lost during the same period.
That does not eliminate AbbVie’s execution risk. Skyrizi and Rinvoq must keep scaling from a much larger base, neuroscience needs to remain a second growth engine, and the company still has to fund dividends, acquisitions and pipeline development. But the investment question is no longer simply whether Humira will decline. It is whether the replacement portfolio can keep compounding fast enough as Humira becomes a much smaller part of the business.
The Post-Humira Revenue Mix Has Already Flipped
AbbVie’s Q2 2026 earnings release reported $8.786 billion of immunology revenue, up 15.1% from the prior year. That portfolio consists primarily of Skyrizi, Rinvoq and Humira.
Comparing those products with AbbVie’s Q2 2025 results shows how the transition occurred in actual dollars rather than percentages alone.
| Product | Q2 2025 Revenue | Q2 2026 Revenue | Dollar Change | Share of Q2 2026 Company Revenue |
|---|---|---|---|---|
| Skyrizi | $4.423B | $5.505B | +$1.082B | 32.4% |
| Rinvoq | $2.028B | $2.525B | +$0.497B | 14.9% |
| Humira | $1.180B | $0.756B | -$0.424B | 4.4% |
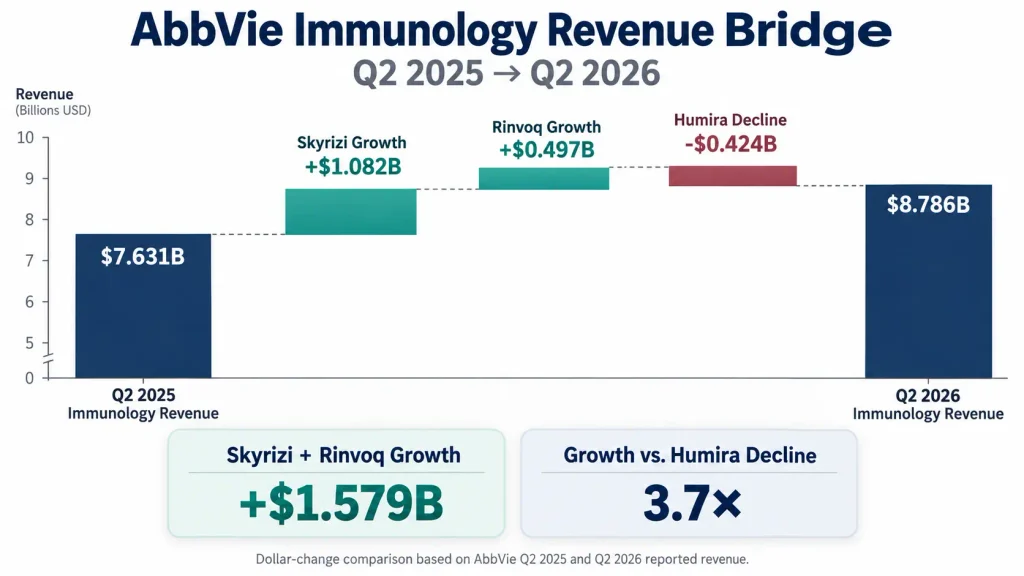
The three products together increased immunology revenue by approximately $1.155 billion. The arithmetic is straightforward: Skyrizi and Rinvoq added $1.579 billion, while Humira removed $424 million.
The mix shift is even more striking when viewed against total company revenue. Skyrizi alone represented about 32.4% of Q2 revenue. Rinvoq contributed another 14.9%. Humira was down to roughly 4.4%.
That means Skyrizi and Rinvoq together were more than ten times the size of Humira during the quarter. For investors evaluating the patent cliff, the more useful question is now how durable the new concentration in those two products will be rather than whether Humira can return to its former scale.
Currency Helped Reported Growth, but the Product Engines Did the Heavy Lifting
AbbVie reported companywide revenue growth of 10.2%, while operational growth was 9.5%. AbbVie defines operational comparisons using prior-year foreign-exchange rates, so the gap indicates that currency translation provided some help to reported growth.
The same distinction appears in immunology. Reported immunology revenue increased 15.1%, compared with 14.6% operational growth. Skyrizi rose 24.4% on a reported basis and 24.0% operationally, while Rinvoq grew 24.5% reported and 23.7% operationally.
Currency was therefore a contributor, but it does not explain the underlying portfolio transition. The dominant driver was still product-level growth.
Neuroscience also provided an important second engine. The portfolio generated $3.228 billion of Q2 revenue, up 20.3% reported and 19.8% operationally. Vraylar reached $1.071 billion, Botox Therapeutic generated $1.042 billion, and Ubrelvy plus Qulipta produced a combined $742 million.
Immunology added about $1.155 billion of revenue year over year, while neuroscience added another $545 million. Those two portfolios together increased by roughly $1.700 billion, helping explain why total company revenue could rise by $1.567 billion even as some other businesses were flat or declining.
This broader diversification matters because replacing a blockbuster patent cliff with only one successor creates a new concentration problem. AbbVie still depends heavily on immunology, but neuroscience gives the company another meaningful source of growth outside Skyrizi and Rinvoq.
The Lower 2026 EPS Guidance Needs Context
AbbVie’s adjusted diluted EPS for Q2 was $3.65, up 22.9% year over year. GAAP diluted EPS was $2.03, compared with $0.52 a year earlier.
The gap between GAAP and adjusted results reflects several company-specified adjustments, including intangible-asset amortization and changes in contingent consideration. Q2 results also included a $0.17 per-share unfavorable impact related to acquired IPR&D and milestones expense.
At the same time, AbbVie lowered its full-year 2026 adjusted EPS range from $13.91–$14.11 to $13.87–$14.07. Reading that change without the acquisition context would make the update look more negative than the company’s explanation supports.
Previous 2026 adjusted EPS guidance: $13.91–$14.11
Updated guidance: $13.87–$14.07
Expected Apogee acquisition dilution: -$0.14 per share
Offset from business overperformance: +$0.10 per share
Net midpoint change: -$0.04 per share
At the July 31 earnings release, AbbVie said the proposed Apogee Therapeutics acquisition was expected to reduce 2026 adjusted EPS by $0.14 per share, while $0.10 of business overperformance offset most of that effect. The four-cent midpoint reduction therefore reflected acquisition dilution more than a broad deterioration in operating performance. AbbVie completed the Apogee acquisition on September 3, 2026 and reaffirmed the $13.87–$14.07 full-year adjusted EPS range, including the $0.14 per-share dilution.
That distinction matters for investors comparing earnings momentum with guidance revisions. A lower forecast can come from weaker operations, but it can also result from acquisition accounting, financing effects or other capital-allocation decisions.
The Cash-Flow Test Adds Context to AbbVie Earnings
Earnings growth is only one part of AbbVie’s investment case. Dividend investors also need to know how much cash remains after capital spending and how that compares with actual cash distributions.
According to AbbVie’s Form 10-Q for the six months ended June 30, 2026, the company generated $7.265 billion of operating cash flow and spent $587 million on property and equipment.
Using the common operating-cash-flow-minus-CapEx approach gives a simple first-half free cash flow estimate of:
$7.265B operating cash flow – $0.587B property and equipment purchases = $6.678B simple FCF
AbbVie paid $6.156 billion of cash dividends over the same six-month period. That produces an FCF payout ratio of approximately 92.2% and simple FCF dividend coverage of about 1.08 times.
| H1 2026 Cash Flow | Amount |
|---|---|
| Operating cash flow | $7.265B |
| Property and equipment purchases | $0.587B |
| Simple FCF | $6.678B |
| Cash dividends paid | $6.156B |
| FCF payout ratio | 92.2% |
| FCF dividend coverage | 1.08× |
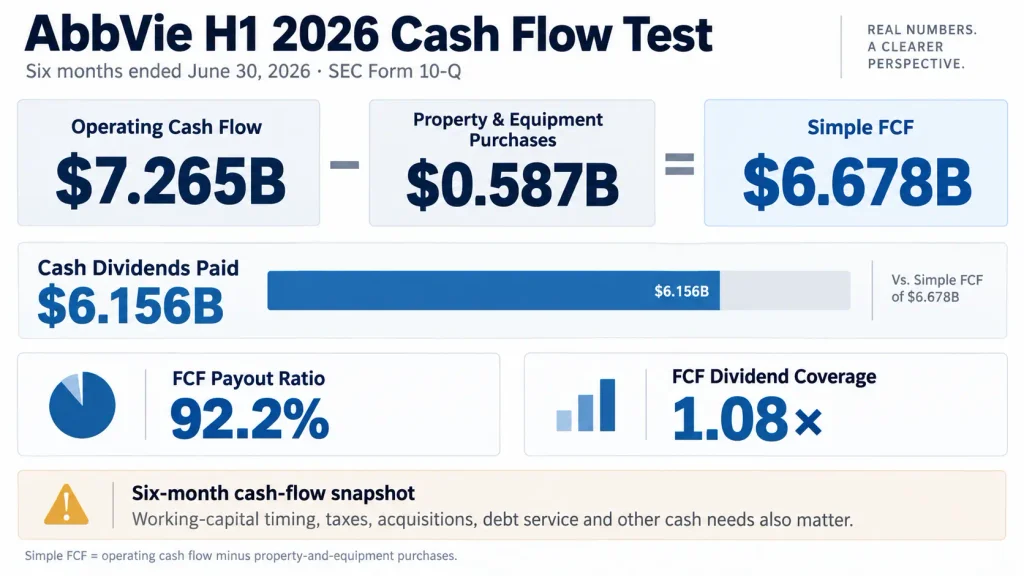
The coverage ratio deserves caution. First-half cash flow can move with taxes, working capital and payment timing. AbbVie also reported $1.784 billion of contingent-consideration payments during the period, and acquisitions, debt service, buybacks and other capital needs compete for cash outside a simple FCF-versus-dividend comparison.
Readers who want to review the underlying mechanics can use the Smart Asset Desk free cash flow guide to see why operating cash flow and capital spending should be checked before relying on a headline FCF number.
The Investment Question Has Changed
Humira’s decline is still relevant, but it is becoming a smaller part of the AbbVie earnings story. The more consequential issue is whether the company can sustain the businesses that replaced it.
Skyrizi and Rinvoq now represent nearly half of quarterly company revenue. That concentration is evidence that the replacement process has progressed, but it also means future growth rates from those products deserve close attention as their revenue bases become larger.
Neuroscience is the second area to watch. Continued growth from Vraylar, Botox Therapeutic, Ubrelvy, Qulipta and Vyalev would reduce the company’s dependence on a single therapeutic category.
Cash conversion is another test. If operating cash flow expands faster than dividend requirements over a full year, the first-half 1.08× coverage figure may prove conservative. If cash flow remains tight while acquisition and pipeline spending rise, the earnings headline alone will not capture the full capital-allocation picture.
The broader lesson also applies to other large pharmaceutical companies facing loss-of-exclusivity risk. A patent cliff is best evaluated by measuring the revenue lost from mature products against the absolute dollar growth created by replacement products and other business lines. The Johnson & Johnson analysis provides a different example of how a large healthcare company balances medicine-related patent pressure with other operating engines.
Frequently Asked Questions
Is Humira still AbbVie’s largest product?
No. In Q2 2026, Humira generated $756 million of global revenue. Skyrizi generated $5.505 billion and Rinvoq generated $2.525 billion during the same quarter. Humira represented about 4.4% of total company revenue, while Skyrizi and Rinvoq together represented approximately 47.3%.
Why did AbbVie lower 2026 EPS guidance after a strong quarter?
At the Q2 earnings release, AbbVie said the proposed Apogee Therapeutics acquisition was expected to be $0.14 dilutive to 2026 adjusted EPS. Approximately $0.10 of business overperformance offset most of that amount, resulting in a four-cent reduction at the midpoint of the guidance range. AbbVie completed the acquisition on September 3, 2026 and subsequently reaffirmed the $13.87–$14.07 full-year adjusted EPS range.
Does 1.08× FCF dividend coverage mean AbbVie’s dividend is unsafe?
Not by itself. The figure uses six months of operating cash flow and property-and-equipment purchases, so it is only a period-specific snapshot. Working-capital timing, taxes, acquisitions, debt service and other cash needs can change the full-year picture. Dividend analysis should therefore use multiple periods and the broader balance-sheet context rather than a single coverage ratio.
Investment disclaimer: This article is for educational and research purposes only and is not a recommendation to buy or sell AbbVie or any other security. Financial data and company conditions may change after the reporting period discussed here. Investors are responsible for their own decisions and investment outcomes.