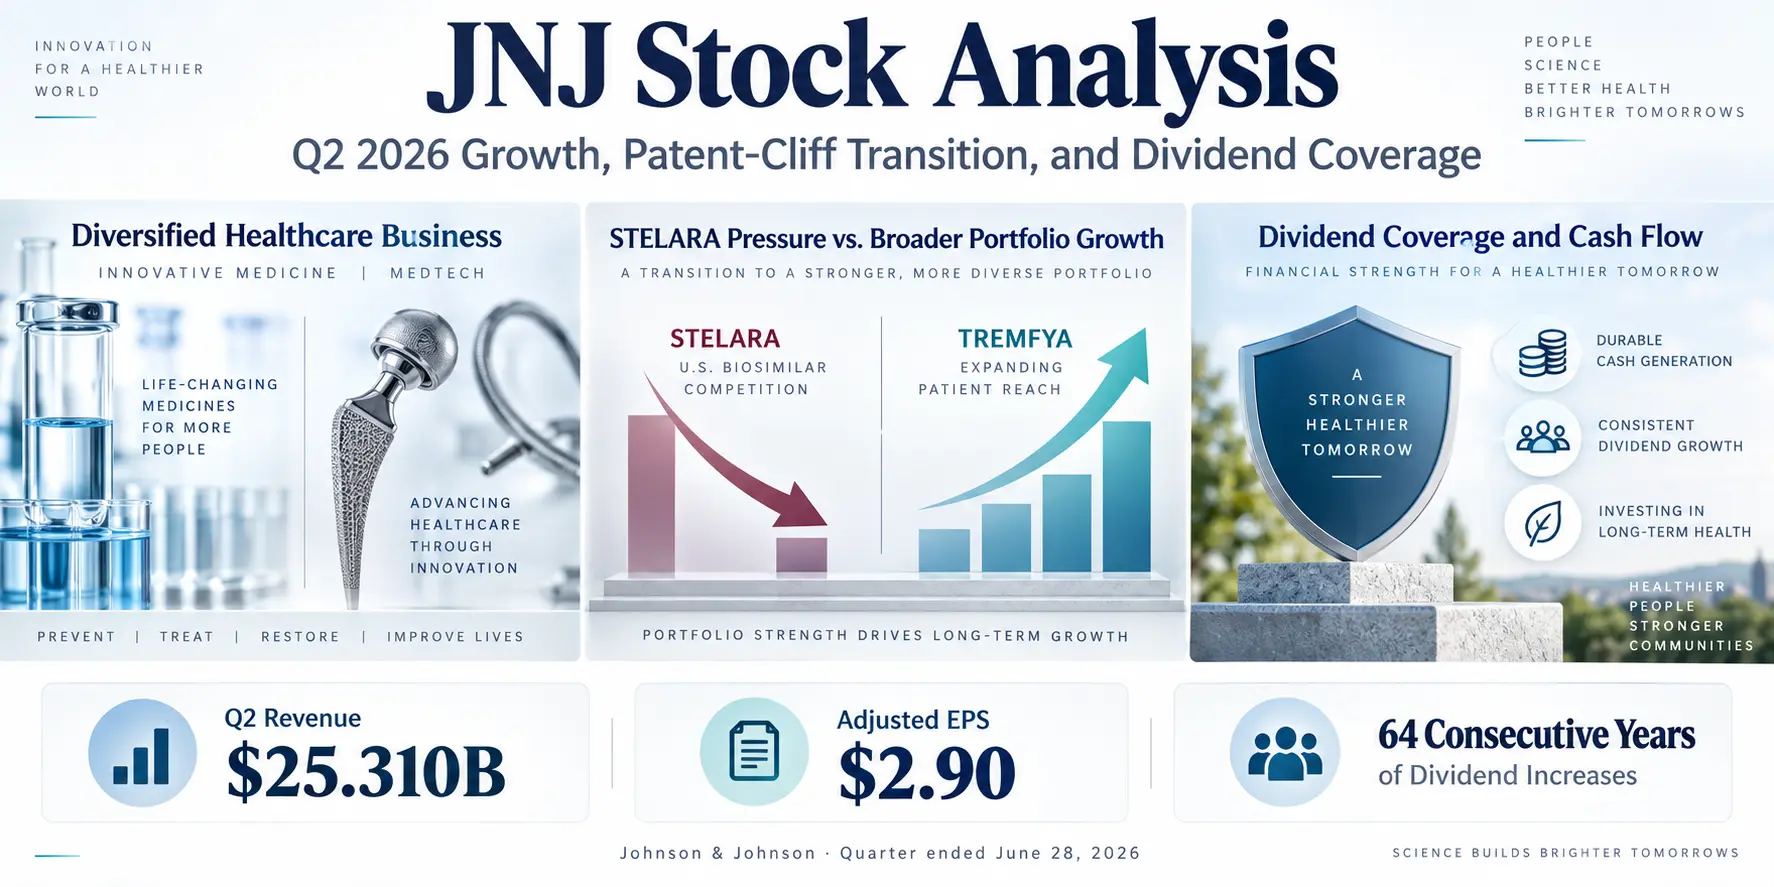
This JNJ stock analysis focuses on the business transition behind Johnson & Johnson’s Q2 2026 results rather than short-term price targets or technical support levels. The company reported $25.310 billion of quarterly sales, up 6.6% year over year, while adjusted diluted EPS increased 4.7% to $2.90.
The more important story is inside the two operating segments. Innovative Medicine continued to grow despite a sharp decline in STELARA, while MedTech expanded sales but faced margin pressure from Orthopaedics separation costs, higher R&D and commercial investment, and tariffs.
Johnson & Johnson also raised its 2026 outlook. At the July earnings release, the company projected reported sales of $100.8 billion to $101.4 billion and adjusted diluted EPS of $11.60 to $11.75.
Q2 2026 reported sales: $25.310B
Innovative Medicine: $16.384B, +7.8%
MedTech: $8.926B, +4.5%
Adjusted diluted EPS: $2.90, +4.7%
These figures come from Johnson & Johnson’s Q2 2026 earnings release and its Form 10-Q for the quarter ended June 28, 2026.
JNJ Q2 2026: The Business Mix After Kenvue
Following the Kenvue separation, Johnson & Johnson reports two operating segments: Innovative Medicine and MedTech. In Q2 2026, Innovative Medicine generated $16.384 billion of sales, or about 64.7% of total company revenue. MedTech produced $8.926 billion, representing roughly 35.3%.
| Q2 2026 Metric | Innovative Medicine | MedTech |
|---|---|---|
| Reported sales | $16.384B | $8.926B |
| Reported sales growth | +7.8% | +4.5% |
| Operational sales growth | +6.8% | +3.6% |
| Share of company sales | 64.7% | 35.3% |
| Segment income before tax / sales | 38.1% | 13.2% |
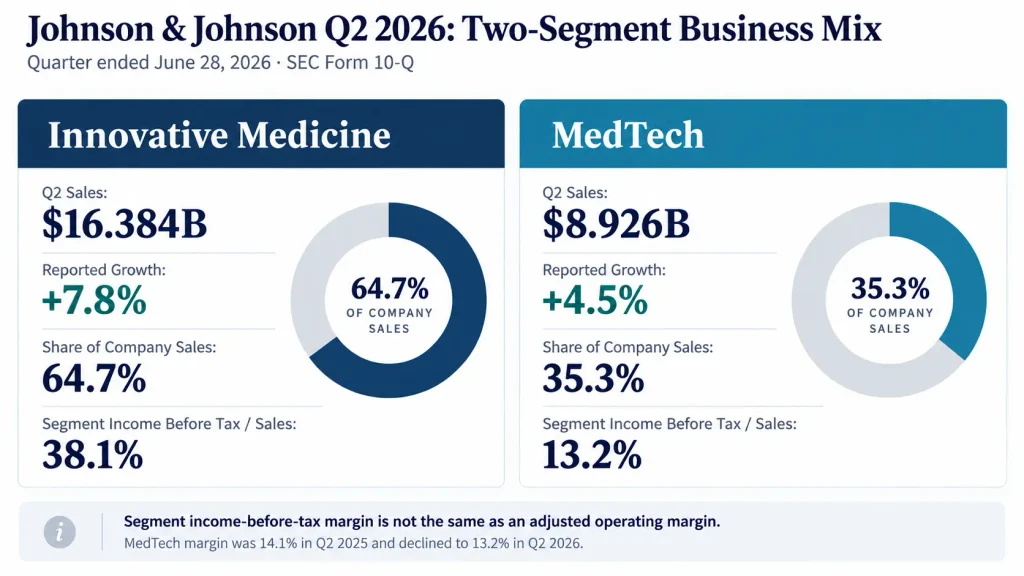
The margin figures need careful labeling. They are reported segment income before tax as a percentage of segment sales, not a generic companywide operating margin.
Innovative Medicine’s reported segment income-before-tax margin increased from 36.5% in Q2 2025 to 38.1% in Q2 2026. MedTech moved in the opposite direction, declining from 14.1% to 13.2%.
MedTech Sales Grew, but Reported Segment Margin Fell
MedTech reported $8.926 billion of Q2 sales, up 4.5% year over year and 3.6% operationally. Johnson & Johnson cited wound closure and biosurgery products, electrophysiology and Shockwave in Cardiovascular, contact lenses in Vision, and trauma in Orthopaedics as growth contributors.
That sales growth did not translate into a higher reported segment income-before-tax margin. The margin fell to 13.2% from 14.1% a year earlier.
The Form 10-Q identifies several reasons for the decline: approximately $0.3 billion of Orthopaedics separation-related costs in the quarter, increased research and development investment, higher commercial spending, and tariffs included in cost of products sold. Operational drivers and favorable currency effects in cost of products sold provided partial offsets.
This distinction matters because a rising revenue line does not automatically mean profitability improved at the same pace. Investors following MedTech should monitor whether separation-related costs and tariff pressure ease while underlying product growth continues.
STELARA Is Falling Fast, but Innovative Medicine Is Still Growing
The patent-cliff issue is most visible in STELARA. Worldwide Q2 revenue declined from $1.653 billion in 2025 to $740 million in 2026, a 55.2% year-over-year decrease.
Johnson & Johnson said STELARA reduced Innovative Medicine operational sales growth by approximately 760 basis points during the quarter. Yet the segment still produced 6.8% operational growth and 7.8% reported growth.
That was possible because several other products expanded at the same time. The company cited DARZALEX, CARVYKTI, TECVAYLI, RYBREVANT/LAZCLUZE, TREMFYA, SPRAVATO and CAPLYTA among the major growth drivers.
TREMFYA provides a clear example of the offset. Its worldwide Q2 revenue increased from $1.186 billion to $2.046 billion, a 72.5% reported increase.

TREMFYA alone does not replace STELARA dollar for dollar, and Johnson & Johnson’s growth comes from a broader portfolio. The more useful question is whether the combined growth from oncology, immunology and neuroscience products continues to exceed the revenue lost from mature franchises.
This is the same analytical problem seen at other large pharmaceutical companies. Our AbbVie Q2 2026 earnings analysis examines how Skyrizi and Rinvoq are offsetting Humira’s decline using the same dollar-change approach.
Cash Flow Gives the Dividend More Context
Johnson & Johnson’s dividend record remains notable, but the dividend history should be analyzed alongside current cash generation rather than treated as a guarantee of future increases.
In April 2026, the board raised the quarterly dividend from $1.30 to $1.34 per share, marking the company’s 64th consecutive year of dividend increases. The indicated annualized dividend became $5.36 per share.
For the six months ended June 28, 2026, Johnson & Johnson generated $11.130 billion of operating cash flow and spent $2.370 billion on additions to property, plant and equipment.
$11.130B operating cash flow – $2.370B PP&E additions = $8.760B simple FCF
$6.358B cash dividends ÷ $8.760B simple FCF ≈ 72.6% FCF payout ratio
$8.760B simple FCF ÷ $6.358B cash dividends ≈ 1.38× FCF coverage
The company’s July earnings release estimated first-half free cash flow at approximately $8.7 billion. The subsequently filed Form 10-Q provides the underlying cash-flow figures, which produce about $8.76 billion using operating cash flow less PP&E additions.
A 1.38× six-month coverage ratio indicates that this simple FCF measure exceeded cash dividends during the period. It does not mean all remaining cash was freely available for dividends or buybacks. During the same six months, Johnson & Johnson also repurchased approximately $4.249 billion of common stock and repaid approximately $2.003 billion of long-term debt.
For more detail on how to interpret payout ratios without relying on a universal safety threshold, see the Smart Asset Desk dividend payout ratio guide.
The Raised 2026 Outlook Supports the Current Operating Trend
Johnson & Johnson raised its 2026 guidance with the Q2 earnings release. The company projected reported sales of $100.8 billion to $101.4 billion, with a midpoint of $101.1 billion.
Adjusted diluted EPS guidance increased to $11.60–$11.75, with an $11.68 midpoint. Johnson & Johnson does not provide GAAP forward guidance for these measures because litigation outcomes, unusual gains and losses, acquisition-related expenses, and purchase-accounting adjustments cannot be predicted with sufficient certainty.
The raised outlook is useful context, but it does not remove the main risks investors should monitor. STELARA erosion remains material, MedTech profitability is under pressure from separation costs and tariffs, and the planned Orthopaedics separation introduces additional execution work.
What Matters Most in the Next JNJ Earnings Reports
The most useful follow-up questions are operational rather than technical-price questions.
- Can Innovative Medicine continue growing despite STELARA erosion? Dollar growth from TREMFYA, oncology and neuroscience products should be compared with the revenue being lost from mature franchises.
- Does MedTech margin recover? Watch whether Orthopaedics separation costs, tariffs and investment spending continue to pressure segment profitability.
- Does cash flow continue to cover dividends comfortably across a full year? Six-month FCF coverage is useful, but working capital, acquisitions, debt repayment and buybacks also compete for cash.
- Does the raised 2026 guidance remain intact? Reported sales and adjusted EPS revisions provide a practical check on whether management’s operating assumptions are holding.
For this reason, the current JNJ stock analysis is better framed around segment growth, patent-cliff replacement, cash conversion and capital allocation than around fixed support levels or predetermined purchase percentages.
Frequently Asked Questions
Is STELARA’s decline causing Johnson & Johnson’s Innovative Medicine segment to shrink?
No. STELARA revenue fell 55.2% year over year in Q2 2026, but Innovative Medicine still grew 7.8% on a reported basis and 6.8% operationally. Growth from products including DARZALEX, CARVYKTI, TECVAYLI, RYBREVANT/LAZCLUZE, TREMFYA, SPRAVATO and CAPLYTA more than offset enough of the decline for the segment to keep expanding.
Did MedTech margin improve in Q2 2026?
No. MedTech sales grew, but reported segment income before tax fell to 13.2% of segment sales from 14.1% a year earlier. Johnson & Johnson cited Orthopaedics separation costs, increased R&D and commercial investment, and tariffs among the pressures on the quarter.
Does Johnson & Johnson’s 64-year dividend growth record guarantee future increases?
No. The record shows a long history of dividend increases, but future payments still depend on cash generation, business performance, debt and capital-allocation priorities. For the first half of 2026, simple FCF covered cash dividends by about 1.38 times, which is useful context but not a guarantee of future dividend growth.
Investment disclaimer: This article is for informational and educational purposes only and does not constitute a recommendation to buy or sell Johnson & Johnson or any other security. Financial data, guidance and company conditions may change after the reporting periods discussed. Investors are responsible for their own decisions and investment outcomes.