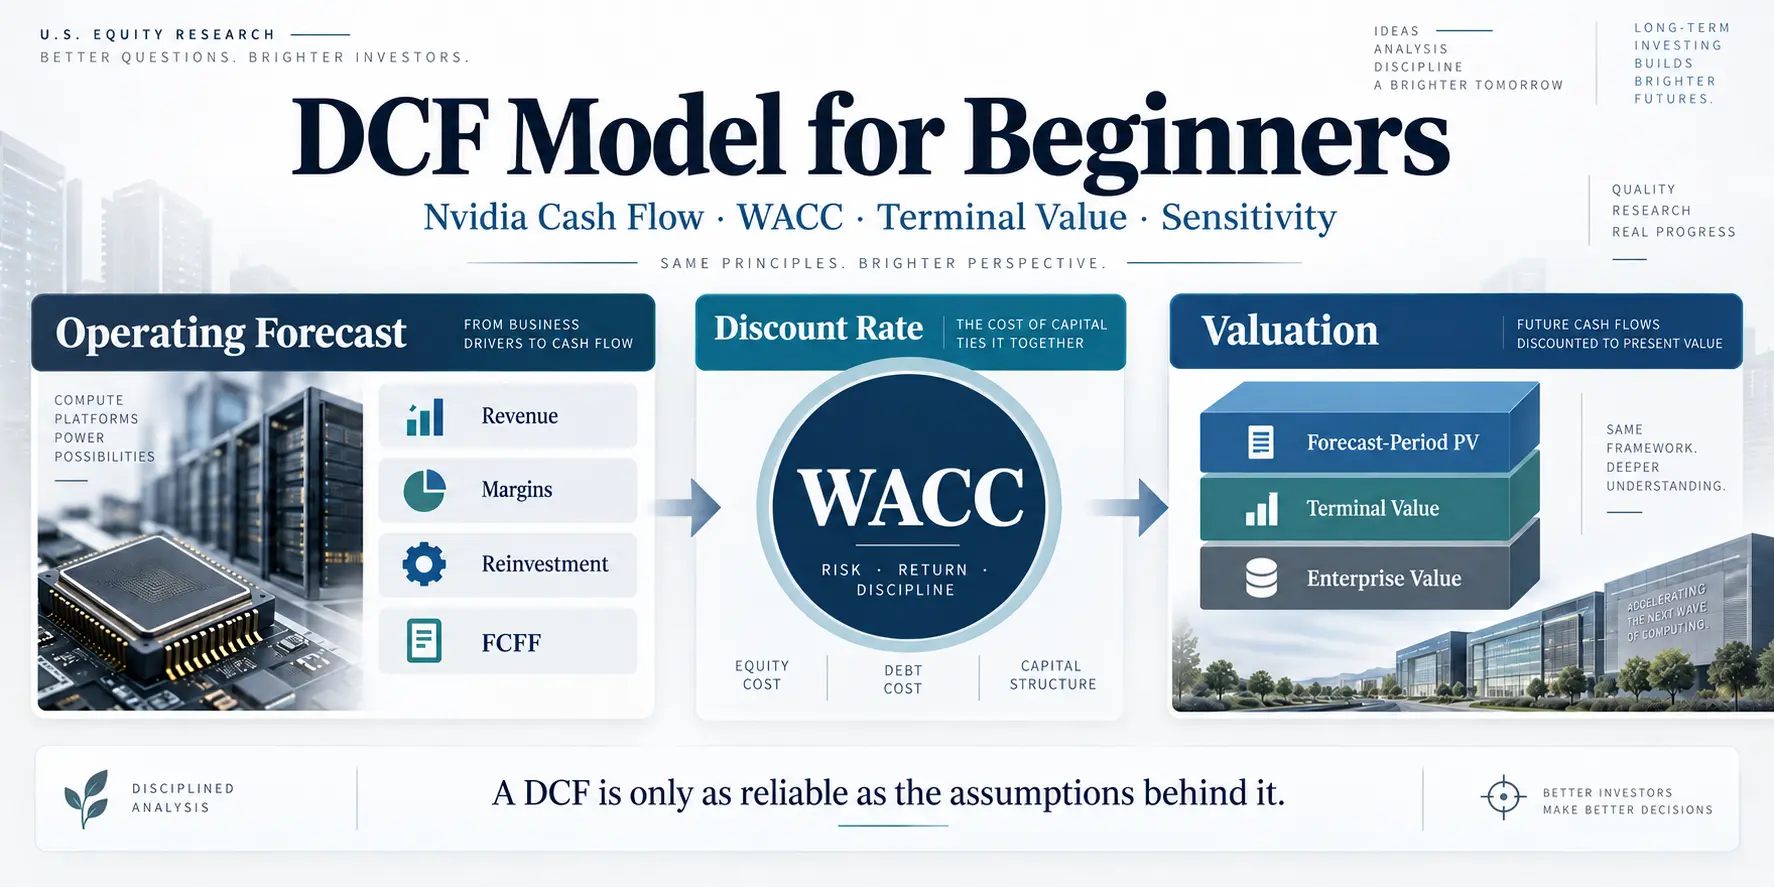
A DCF model for beginners should start with the cash flow being valued, not with a desired share-price target. Discounted cash flow analysis estimates what a business is worth by projecting future cash flows, discounting them for risk and time, and adding a value for the cash flows expected beyond the explicit forecast period.
Nvidia provides a useful case study because its recent financial results combine rapid revenue growth, strong operating cash generation, large working-capital movements, product-transition risk, and unusually fast changes in AI infrastructure demand. Those characteristics also make false precision especially dangerous. A valuation can look mathematically exact while still depending heavily on uncertain assumptions about margins, reinvestment, terminal growth, and the cost of capital.
This guide therefore does not assign Nvidia a single intrinsic share price. Instead, it shows how to build the DCF correctly, where Nvidia’s reported cash-flow data fits into the process, and why sensitivity analysis matters before converting a model into a per-share valuation.
DCF Model for Beginners: What Does a DCF Actually Discount?
A firm-value DCF generally forecasts free cash flow to the firm, or FCFF, and discounts those cash flows using the weighted average cost of capital, or WACC.
A common simplified FCFF structure is:
FCFF ≈ NOPAT + Depreciation & Amortization − Capital Expenditures − Increase in Net Working Capital
NOPAT represents after-tax operating profit before financing costs. The objective is to estimate cash generated by the operating assets that is available to both debt and equity capital providers.
This is different from simply taking cash flow from operations and subtracting a capital-spending line. The common Operating Cash Flow − CapEx calculation can be useful for analyzing reported cash generation, but it is not automatically identical to FCFF because operating cash flow can contain financing-related tax effects, working-capital movements, stock-based compensation add-backs, and other items that may require normalization.
For a deeper explanation of reported free cash flow and its limitations, see the Smart Asset Desk Free Cash Flow Guide. The CapEx and free cash flow guide also explains why investment spending should be interpreted separately from the economic return eventually produced by that investment.
Once FCFF has been estimated, each forecast-period cash flow is discounted at WACC. A simplified present-value structure is:
Enterprise Value ≈ Present Value of Forecast FCFF + Present Value of Terminal Value
For a perpetual-growth terminal value:
Terminal Value = FCFFn+1 ÷ (WACC − g)
The formula requires WACC to remain above the perpetual growth rate. Because the difference between WACC and g appears in the denominator, relatively small changes in either assumption can materially change terminal value.
WACC should not be treated as a universal 8%, 10%, or 12% rule for large-cap stocks. It depends on the company’s equity risk, debt cost, tax rate, and capital structure. Our ROIC vs WACC guide explains how WACC is constructed and why the cost of capital also matters when evaluating whether reinvestment creates economic value.
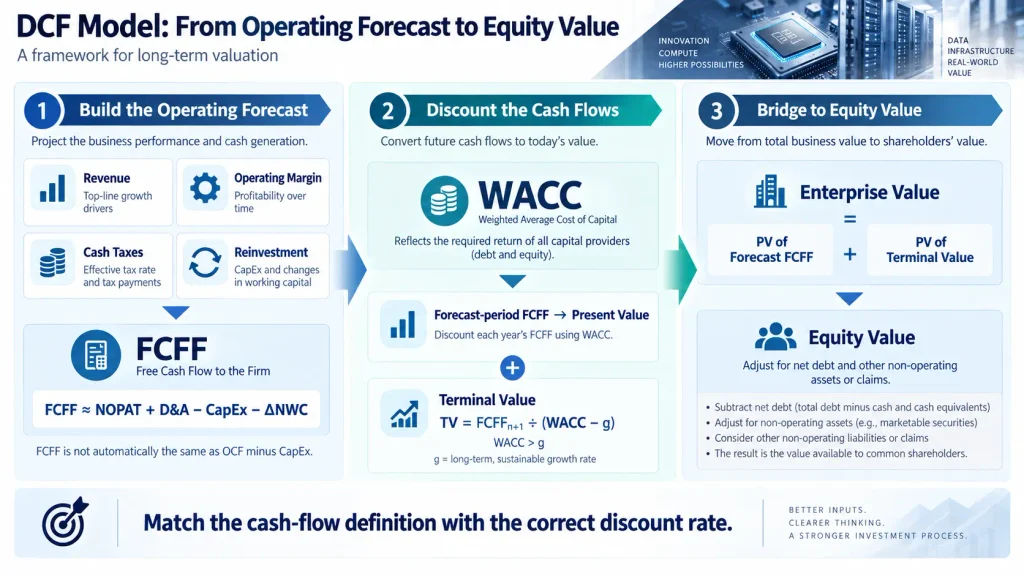
A firm-value DCF forecasts FCFF, discounts those cash flows at WACC, adds the present value of terminal value, and then adjusts enterprise value for net debt and other non-operating claims or assets to reach equity value.
Nvidia’s Reported Cash Flow Is the Starting Point, Not the DCF Answer
Nvidia’s fiscal 2026 Form 10-K provides a useful historical base for a DCF forecast. For the fiscal year ended January 25, 2026, the company reported revenue of $215.938 billion, compared with $130.497 billion in fiscal 2025.
Net cash provided by operating activities increased from $64.089 billion to $102.718 billion. Nvidia also reported $6.042 billion of purchases related to property and equipment and intangible assets in fiscal 2026, compared with $3.236 billion in fiscal 2025.
| Reported / Calculated Metric | FY2025 | FY2026 | Change |
|---|---|---|---|
| Revenue | $130.497B | $215.938B | +65.5% |
| Operating Cash Flow | $64.089B | $102.718B | +60.3% |
| Purchases Related to PP&E and Intangible Assets | $3.236B | $6.042B | +86.7% |
| OCF Less the Above Purchase Line | $60.853B | $96.676B | +58.9% |
The last row is a simple analytical subtraction, not a company-reported GAAP or standardized FCFF measure. Nvidia’s investing cash-flow line combines purchases related to property and equipment with intangible assets, so it should not automatically be substituted for a precisely defined CapEx figure in a full valuation model.
The historical operating base nevertheless shows why Nvidia attracts DCF analysis. Fiscal 2026 Data Center revenue reached $193.737 billion, up from $115.186 billion in fiscal 2025 and representing about 89.7% of total fiscal 2026 revenue.
These figures can be verified in Nvidia’s FY2026 Form 10-K.
How to Turn Nvidia’s Financial Statements Into a DCF Forecast
The historical numbers are only the starting point. A DCF requires forward assumptions, and every major assumption should be visible rather than hidden inside a final share-price output.
- Forecast revenue. Estimate how Nvidia’s Data Center, Gaming, and other businesses may develop over the explicit forecast period rather than extending one exceptional growth year indefinitely.
- Forecast operating margins. Build in product mix, supply costs, competitive pricing, export restrictions, and the possibility that unusually high margins may change over time.
- Estimate cash taxes and NOPAT. Apply a consistent operating tax assumption rather than using net income directly in an FCFF model.
- Model reinvestment. Include capital expenditures, depreciation, working-capital needs, and other operating investment required to support the forecast revenue base.
- Calculate FCFF. Use the same accounting definitions throughout the model.
- Estimate WACC. Build the discount rate from a current cost of equity, after-tax cost of debt, and capital structure rather than applying a universal large-cap percentage.
- Calculate terminal value. Use a sustainable long-run growth rate and ensure WACC remains above g.
- Bridge enterprise value to equity value. Adjust for net debt and other relevant non-operating assets or claims, then divide by an appropriate diluted share count if estimating value per share.
That sequence is why a credible DCF cannot be reconstructed from only a WACC assumption, a perpetual growth rate, and a desired stock price. The cash-flow forecast has to explain where the value comes from.
DCF Sensitivity: Why the WACC Minus Growth Spread Matters
The perpetual-growth formula makes sensitivity easy to see even before building a complete Nvidia model.
Assume the terminal value is expressed as a multiple of the next-period FCFF. The following examples change only WACC and perpetual growth:
| Illustrative Case | WACC | Perpetual Growth | WACC − g | Terminal Value Factor on FCFFn+1 |
|---|---|---|---|---|
| Smaller Spread | 9.0% | 4.0% | 5.0% | 20.0× |
| Middle Example | 10.0% | 3.0% | 7.0% | 14.3× |
| Wider Spread | 11.0% | 2.0% | 9.0% | 11.1× |
These are not Nvidia fair values. They isolate only the terminal-value denominator. A complete DCF must also include the present value of the explicit forecast-period cash flows and the enterprise-to-equity value bridge.
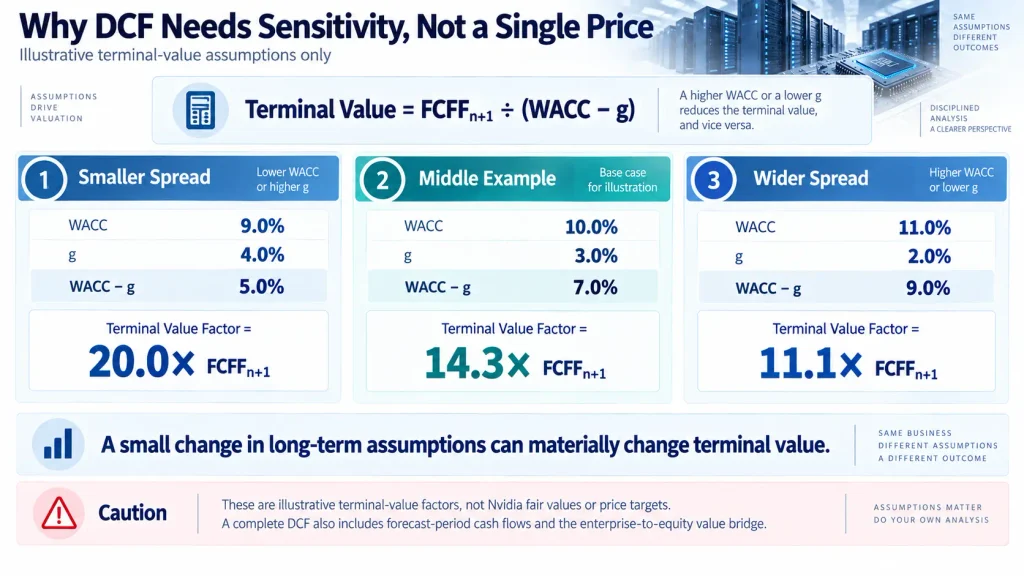
This sensitivity example isolates the terminal-value formula rather than estimating Nvidia’s share price. A smaller WACC-minus-growth spread produces a much larger terminal-value factor, which is why a DCF should be tested across multiple assumptions.
The Latest Nvidia Filing Shows Why a DCF Must Be Updated
A DCF is not a one-time spreadsheet. New filings can materially change the revenue, margin, working-capital, and reinvestment assumptions that drive the model.
For the six months ended July 26, 2026, Nvidia reported revenue of $177.837 billion, compared with $90.805 billion in the prior-year period. Net cash provided by operating activities increased to $74.421 billion from $42.779 billion.
Purchases related to property and equipment and intangible assets were $4.434 billion for the first half of fiscal 2027, compared with $3.122 billion for the comparable fiscal 2026 period.
Nvidia also reported a 75.0% gross margin for the first half of fiscal 2027 versus 66.6% in the prior-year period. That comparison needs context: the first half of fiscal 2026 was materially affected by a $4.5 billion H20 excess-inventory and purchase-obligation charge. The improvement should therefore not be interpreted as if every percentage point came from ordinary operating expansion.
The company’s Form 10-Q for the quarter ended July 26, 2026 also shows that Blackwell Ultra drove substantial year-over-year growth while customer concentration and export restrictions remained important risks.
A current Nvidia DCF should therefore revisit at least revenue growth, normalized margins, working capital, reinvestment, China-related assumptions, and the cost of capital whenever new results materially change the operating picture.
Five DCF Errors That Create False Precision
Using Reported FCF as FCFF Without Checking the Definition
Cash flow from operations minus a capital-spending line is a useful cash-generation metric, but it is not automatically the unlevered FCFF required by a firm-value DCF. Confirm the tax, working-capital, financing, and reinvestment treatment before using the figure.
Using a Fixed WACC Because the Company Is a Large Cap
There is no universal discount rate for large U.S. companies. Changes in risk-free rates, equity risk estimates, debt costs, business risk, and capital structure can all change an appropriate WACC estimate.
Allowing Terminal Value to Dominate Without Testing It
If most of the calculated enterprise value comes from terminal value, the model is heavily dependent on long-term assumptions that are difficult to forecast. Test multiple combinations of WACC and g rather than treating one pair as the answer.
Treating a Bull, Base, or Bear Price as a Technical Support Level
A DCF value and a chart support level come from different analytical methods. A calculated intrinsic-value estimate does not become a technical floor simply because the market previously traded near that price.
Ignoring One-Time or Regulatory Effects
Nvidia’s H20 charge is a current example of why historical margins require context. Export restrictions, inventory provisions, product transitions, and customer concentration can affect the cash-flow base used to forecast future results.
What a Beginner Should Take From an Nvidia DCF
The value of a DCF is not the appearance of mathematical certainty. Its real benefit is that it forces the investor to state what must happen for a valuation to be justified.
For Nvidia, the important questions include how long extraordinary AI infrastructure demand can persist, how margins evolve as product generations change, how much additional operating investment is required, and whether the cash returns on that investment remain high enough to justify the capital committed.
A useful Nvidia DCF should therefore produce a range of outcomes tied to visible assumptions. If changing a reasonable WACC, terminal growth rate, operating margin, or reinvestment assumption radically changes the result, that sensitivity is information rather than a flaw to hide.
Frequently Asked Questions
Should a beginner use free cash flow or FCFF in a DCF?
For an enterprise-value DCF discounted at WACC, FCFF is the conceptually consistent cash flow. A simple operating-cash-flow-minus-CapEx figure can be useful as a reporting cross-check, but investors should not assume that it is automatically identical to FCFF.
What WACC should be used for Nvidia?
There is no permanent Nvidia WACC that can be applied across all market conditions. A current estimate should reflect the prevailing risk-free rate, equity risk assumptions, company-specific risk, debt costs, taxes, and capital structure. Testing a reasonable range is more informative than relying on a fixed large-cap rule.
Why does this Nvidia DCF guide not publish one fair-value price?
A defensible per-share value requires a complete set of explicit forecasts for operating performance, reinvestment, discount rates, terminal assumptions, balance-sheet adjustments, and diluted shares. Publishing a precise target without showing those inputs would create false precision rather than a reproducible valuation.
Investment Disclaimer
This article is for informational and educational purposes only and is not a recommendation to buy or sell Nvidia or any other security. Financial figures are based on the cited company filings for the periods discussed and may change in future reporting periods. DCF results depend heavily on assumptions and methodology. Investors are responsible for their own research, decisions, and outcomes.