
A company can report a high return on equity while generating a much weaker return on the capital committed to its operations. That difference is one reason investors examine return on invested capital (ROIC) alongside profitability, leverage, and free cash flow.
An ROIC investing strategy evaluates how much after-tax operating profit a company generates relative to the capital used in its business. It can help identify businesses with attractive operating economics, but a high ratio alone does not prove that a company has an economic moat, creates shareholder value, or represents an attractive investment at its current stock price.
The more useful approach is to define invested capital consistently, compare ROIC with the estimated cost of capital, and examine whether additional investment can generate attractive returns over time.
Cash generation provides an important cross-check. Our Free Cash Flow Guide explains why reported earnings and operating cash generation can diverge, particularly when capital expenditures and working-capital requirements change.
How ROIC Helps Investors Evaluate Operating Performance
Return on invested capital compares net operating profit after tax (NOPAT) with the capital invested in the company’s operating activities.
Basic ROIC formula
ROIC = NOPAT ÷ Average Invested Capital × 100
NOPAT is commonly estimated from operating income after applying an appropriate tax rate.
The definition of invested capital must remain consistent between reporting periods and across the companies being compared.
One commonly used approach starts with operating assets minus non-interest-bearing operating liabilities. Another financing-based approach starts with equity plus interest-bearing debt and makes appropriate adjustments for excess cash and other nonoperating items.
These approaches should reconcile conceptually when their components are defined consistently, but different treatments of goodwill, acquired intangible assets, leases, excess cash, and other adjustments can produce different reported ROIC figures.
There is no single ROIC calculation mandated for all U.S. companies under GAAP. Investors should therefore examine the methodology behind a data provider’s headline percentage before making comparisons.
Why ROE and ROIC Can Tell Different Stories
Return on equity (ROE) compares net income with shareholders’ equity. ROIC instead focuses on after-tax operating profit and the capital committed to operations.
The distinction matters because changes in borrowing, share repurchases, and book equity can affect ROE even when the underlying business has not become more productive.
Debt does not automatically increase ROE. Its impact depends on how the borrowed money is used, the return earned on that investment, interest expenses, taxes, and the resulting equity base.
ROIC reduces some financing-related distortions by using an operating profit measure, but it is not entirely immune to accounting choices or financing decisions. Repurchases, acquisitions, lease accounting, and asset impairments can affect the invested-capital calculation.
A useful comparison therefore begins with the formulas rather than assuming that one ratio always gives the correct answer.
| Measure | Numerator | Denominator | Primary Use |
|---|---|---|---|
| ROE | Net income | Average shareholders’ equity | Shareholder-level accounting profitability |
| ROIC | NOPAT | Average invested capital | Operating return relative to committed capital |
Average balance-sheet denominators are often preferable to using a single year-end balance when capital changes materially during the reporting period.
For a more detailed comparison of these two measures, see ROE vs ROIC: How to Compare Capital Efficiency and Leverage.
A Reproducible ROIC Calculation
Consider a hypothetical company with annual operating income of $30 million, an assumed effective operating tax rate of 25%, and average invested capital of $200 million.
The example uses a simplified tax assumption to demonstrate the mechanics. It does not represent a real company’s reported results.
NOPAT = $30M × (1 − 0.25) = $22.5M
ROIC = $22.5M ÷ $200M × 100 = 11.25%
The company’s estimated return on invested capital is 11.25% under these assumptions.
Now consider what would happen if the same company generated $22.5 million of NOPAT but required $250 million of average invested capital.
ROIC = $22.5M ÷ $250M × 100 = 9.00%
Operating profit has not changed, but the amount of capital required to produce it has increased. The lower ROIC reflects weaker capital efficiency under the stated calculation.
This comparison does not identify why invested capital rose. A company may be building a new facility, completing an acquisition, accumulating operating assets, or experiencing changes in asset utilization.
The investment thesis depends on whether the additional capital eventually generates enough incremental operating profit to justify its cost.
ROIC vs. WACC: When Does Capital Generate Economic Value?
Return on invested capital becomes more informative when considered alongside the weighted average cost of capital (WACC).
WACC represents an estimate of the blended required return associated with financing the business through debt and equity. It is an analytical estimate rather than a directly observable accounting expense.
Consider a hypothetical business with ROIC of 12.5% and an estimated WACC of 7.0%.
ROIC − WACC = 12.5% − 7.0% = 5.5 percentage points
A positive spread suggests that the company’s operating return exceeds the estimated cost of the capital committed to its business.
The corresponding simplified economic profit calculation is:
Economic Profit = (ROIC − WACC) × Invested Capital
Using an assumed invested-capital base of $200 million produces:
Economic Profit = 5.5% × $200M = $11M
The resulting $11 million represents estimated economic profit for the illustrative period under these assumptions. It is not the same as free cash flow, an additional cash receipt, or a guaranteed increase in shareholder wealth.
When ROIC falls below the estimated cost of capital, the spread becomes negative. Sustained negative spreads can indicate that resources are being committed to activities with inadequate economic returns.
However, a single negative year does not automatically establish permanent value destruction. Major capital investments can increase the invested-capital denominator before the resulting operating profit appears.
The quality of the WACC estimate also matters. Changes in the risk-free rate, borrowing costs, equity risk assumptions, and target capital structure can alter the estimated hurdle rate.
For example, the Federal Reserve Bank of St. Louis FRED database provides historical interest-rate series that may be relevant to WACC assumptions. A Treasury yield alone, however, is not a complete estimate of WACC.
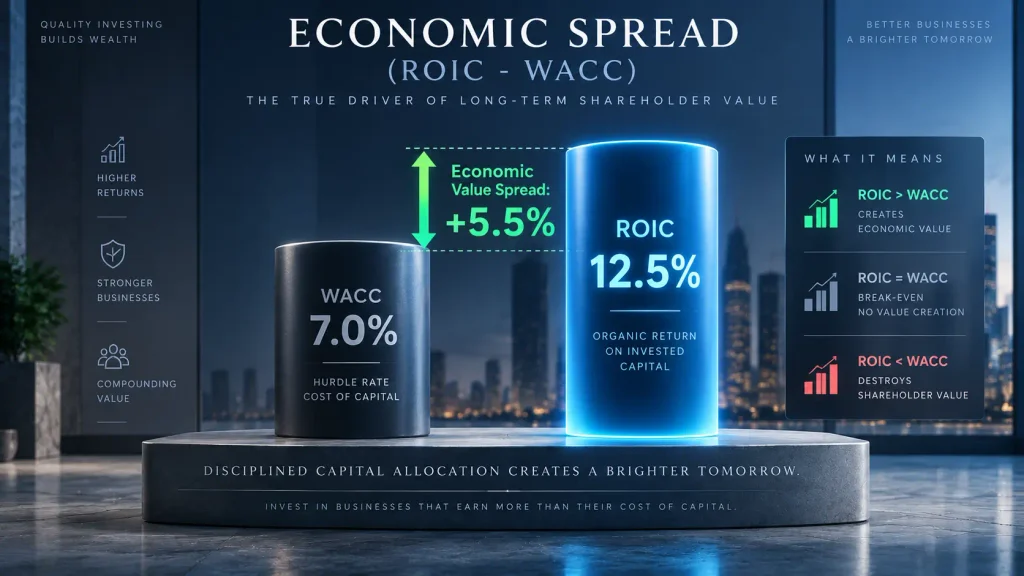
This illustration uses hypothetical ROIC of 12.5% and WACC of 7.0% to show a positive spread of 5.5 percentage points. The figure assumes consistent capital definitions and an estimated cost of capital; it is not a verified return for a specific company or a guarantee of shareholder value creation.
For a dedicated discussion of the spread and its limitations, read ROIC vs WACC: How to Measure Economic Profit and Capital Allocation.
What a Ten-Year ROIC Review Can Reveal
A single high ROIC reading provides limited information about whether a competitive advantage is sustainable.
Investors may obtain a more useful picture by reviewing a consistent ROIC series across multiple economic conditions. Ten years can be a practical observation window for an established company, although businesses with shorter reporting histories require a different approach.
The analysis should focus on the economic drivers behind the numbers rather than imposing one universal percentage threshold.
Consistency Across Economic Cycles
Begin by comparing the distribution of annual ROIC readings rather than relying exclusively on an average.
A company reporting unusually high returns in one year may have benefited from a temporary earnings gain, a depressed invested-capital base, or an accounting adjustment.
Stable returns across a range of operating conditions may provide stronger evidence of consistent economics, although they do not establish the existence of a permanent moat.
How Much Capital Is Required for Growth?
Revenue growth does not automatically translate into value creation. A business may grow sales while requiring increasingly large investments in production facilities, working capital, acquisitions, or infrastructure.
Investors should examine how invested capital and NOPAT change together over time.
When reliable data are available, incremental return on invested capital can provide an additional perspective:
Incremental ROIC = Change in NOPAT ÷ Change in Invested Capital
This measure also requires caution. Timing differences, acquisitions, restructuring, and small or negative changes in invested capital can make the calculation unstable.
Major investment projects may require several years before their contribution to NOPAT becomes visible.
Cash Flow and Reinvestment Requirements
High ROIC and strong free cash flow can reinforce each other, but they should not be treated as interchangeable.
A company can report attractive operating returns while undertaking substantial capital expenditures that temporarily reduce free cash flow.
Conversely, a company with temporarily low capital spending may generate strong free cash flow without demonstrating attractive returns on future investments.
Investors can use How CapEx Affects Free Cash Flow to examine the distinction between maintenance spending and growth investment, including why an undisclosed split should not be invented.
Debt, Acquisitions, and Accounting Adjustments
ROIC analysis should include changes in debt, goodwill, operating assets, and the capital structure.
Acquisitions can increase invested capital before the acquired business achieves its expected earnings contribution. Goodwill impairments may later reduce book invested capital, potentially raising a calculated ROIC even when operating performance has not improved.
Share repurchases can also change balance-sheet relationships. Their effect on ROIC depends on the source of financing, the treatment of excess cash, and the specific invested-capital definition.
These adjustments should be disclosed and applied consistently when comparing years or companies.
Comparing Economic Moats Without Unsupported ROIC Rankings
Apple, Microsoft, Alphabet, and Coca-Cola operate businesses with very different capital requirements and economic characteristics.
Apple’s hardware ecosystem and services operations differ substantially from Microsoft’s enterprise software and cloud infrastructure businesses. Alphabet operates a combination of advertising platforms and capital-intensive infrastructure, while Coca-Cola’s reported economics reflect its beverage business and bottling arrangements.
These differences influence both operating profit and the assets included in invested capital.
A cross-company ROIC comparison should therefore identify the accounting definition, source, and calculation period before presenting numerical rankings.
| Company | Business Characteristics | Items to Verify Before Comparing ROIC |
|---|---|---|
| Apple (AAPL) | Devices, services, ecosystem economics | Book equity, share repurchases, operating assets, supplier-related working capital |
| Microsoft (MSFT) | Enterprise software, cloud and AI infrastructure | Cloud capital expenditures, acquisitions, goodwill, operating leases |
| Alphabet (GOOGL) | Advertising, cloud and infrastructure investment | Cash exclusions, infrastructure investment, segment economics, capitalized assets |
| Coca-Cola (KO) | Branded beverages and global distribution relationships | Bottling structure, intangible assets, acquisitions, operating capital |
The table identifies research considerations rather than claiming verified numerical rankings.
A defensible ten-year comparison requires annual NOPAT and invested-capital figures calculated using a consistent methodology, followed by a review of acquisitions, asset sales, accounting changes, and business-model differences.
Company filings can be retrieved through the SEC EDGAR filing search. Annual reports, including Forms 10-K, provide the underlying income statements and balance sheets needed to begin that process.
Where an ROIC Investing Strategy Can Fail
Even a carefully constructed ROIC series has limitations.
- Invested-capital definitions vary. Cash exclusions, goodwill, leases, and operating liabilities can materially change the denominator.
- Asset impairments can distort comparisons. A lower book asset base may increase ROIC without demonstrating improved operating performance.
- Historical returns do not guarantee future returns. Competitive threats, regulation, technology changes, and changing customer behavior can alter the economics.
- High ROIC does not guarantee a favorable stock return. The purchase price and expectations embedded in valuation matter.
- Reinvestment opportunities are finite. A highly profitable business may have limited opportunities to invest additional capital at similarly attractive returns.
- Financial institutions require specialized analysis. Bank and insurance company capital structures make conventional industrial-company ROIC definitions less directly applicable.
The practical goal is to use ROIC as evidence about a company’s operating economics, not as a substitute for competitive analysis, cash flow research, or valuation.
How to Apply ROIC in a Long-Term Investment Review
Investors assessing a potential long-term holding can organize the review around four questions.
- Are operating returns attractive? Calculate NOPAT and invested capital using consistent definitions, then compare multiple years.
- Does ROIC exceed the estimated cost of capital? Examine the ROIC-WACC spread while recognizing that WACC is an estimate with meaningful uncertainty.
- Can the company reinvest profitably? Review revenue growth, incremental operating profit, capital expenditures, acquisitions, and the resulting returns on additional capital.
- Is the valuation reasonable? Compare the company’s operating prospects with the expectations implied by its market valuation. Strong operating economics do not eliminate the risk of overpaying for shares.
A related measure is cash conversion. Comparing accounting profit with free cash flow can help identify whether reported earnings are accompanied by cash remaining after capital expenditures.
Our Apple Free Cash Flow Conversion Ratio Analysis illustrates how GAAP net income can rise while calculated free cash flow declines, and why unusual tax items can complicate the interpretation.
ROIC, cash conversion, and valuation provide different pieces of the analysis. None should be treated as a complete stand-alone measure of investment quality.
Frequently Asked Questions
Does a high ROIC prove that a business has an economic moat?
No. A persistently high ROIC can be consistent with competitive advantages, but it may also reflect accounting adjustments, limited capital requirements, or favorable industry conditions. Investors should examine the source and sustainability of returns before drawing conclusions about an economic moat.
Can ROIC increase even when a company’s business has not improved?
Yes. Impairments, asset disposals, changes in invested-capital definitions, and shifts in the capital base can increase a calculated ROIC without corresponding improvements in operating profit. A year-over-year comparison should review both NOPAT and the denominator.
Is a positive ROIC-WACC spread a guarantee of strong stock performance?
No. A positive spread suggests economic value creation under the stated accounting and cost-of-capital assumptions. Shareholder returns also depend on valuation, future growth, competitive conditions, capital allocation, and the expectations reflected in the stock price.
Bottom Line
ROIC is most useful when it helps investors understand the relationship between operating profit, capital requirements, and future reinvestment opportunities.
The analysis becomes more informative when a consistent ROIC calculation is compared with the estimated cost of capital and supported by a review of cash flow, acquisitions, debt, and valuation.
A high historical ROIC may justify further research. It does not, by itself, prove the existence of a durable moat or establish an attractive entry price.
Investment Notice & Disclaimer
This article is provided for educational and investment research purposes only. It is not a recommendation to buy or sell any security. Financial data, estimates, accounting definitions, and market conditions can change over time. Investors are responsible for their own decisions and investment outcomes.