A chipmaker can report faster revenue growth, higher gross profit, and a stronger gross margin while generating less free cash flow. Taiwan Semiconductor Manufacturing Company (NYSE: TSM) provided a useful example in the second quarter of 2026.
TSMC’s revenue increased 12.0% sequentially, and its gross margin rose from 66.2% to 67.7%. Yet its quarterly free cash flow declined from NT$348.21 billion to NT$287.36 billion as capital spending accelerated.
The contrast raises an important question for investors analyzing semiconductor gross margin: how much of an apparent profitability improvement comes from better manufacturing economics, and how much cash does the company need to sustain its growth?
A semiconductor foundry’s gross margin reflects more than demand for chips. Factory utilization, manufacturing yields, process-node mix, pricing, depreciation, and the cost of ramping new capacity can move profitability in different directions. Gross margin must also be evaluated separately from free cash flow.
This analysis uses TSMC’s reported Q1 and Q2 2026 financial results and management commentary from July 16, 2026. It also distinguishes the company’s historical Q3 guidance from revenue information subsequently released on October 8, 2026. The financial data and reporting status are reviewed as of October 12, 2026.
TSMC’s Q2 2026 Results Show Why Margin Quality Matters
The most useful place to begin is the income statement rather than the manufacturing narrative.
TSMC generated NT$1,270.38 billion in Q2 2026 revenue, compared with NT$1,134.10 billion in Q1. Gross profit increased from NT$751.30 billion to NT$860.31 billion.
Cost of revenue also increased, but at a slower rate than sales.
| Financial Metric | Q1 2026 | Q2 2026 | Change |
|---|---|---|---|
| Revenue | 1,134.10 | 1,270.38 | +12.0% |
| Cost of Revenue | 382.80 | 410.07 | +7.1% |
| Gross Profit | 751.30 | 860.31 | +14.5% |
| Gross Margin | 66.2% | 67.7% | +1.5 pp |
Amounts are in NT$ billions unless otherwise stated. Percentage changes are rounded. Source: TSMC Q2 2026 earnings presentation filed with the SEC. The company’s consolidated financial statements are prepared under TIFRS.
The relationship between revenue and cost growth explains the reported margin expansion at the accounting level.
Revenue grew approximately 12.0%, while cost of revenue increased only 7.1%. As a result, gross profit grew about 14.5%, outpacing sales.
That is a favorable outcome. But it does not yet tell investors how much improvement came from stronger pricing, higher factory utilization, favorable technology mix, or manufacturing productivity.
Separating Sales Growth From the Gross Margin Improvement
Gross margin is calculated as gross profit divided by revenue.
Gross Margin = (Revenue – Cost of Revenue) / Revenue × 100
For TSMC’s Q2 2026 results:
(1,270.38 – 410.07) / 1,270.38 × 100 ≈ 67.7%
The formula establishes the reported profitability level. A second calculation can help reveal how much additional gross profit is associated with revenue growth versus the change in margin.
A Gross Profit Bridge Using TSMC’s Reported Results
TSMC earned NT$751.30 billion of gross profit in Q1 2026.
Suppose Q2 revenue had reached its actual level of NT$1,270.38 billion, but the company had maintained its precise Q1 gross margin rather than improving it.
Using Q1 reported gross profit divided by Q1 reported revenue gives the margin needed for this hypothetical calculation.
Q1 Gross Margin (unrounded) = 751.30 / 1,134.10
Apply that ratio to Q2 revenue:
1,270.38 × (751.30 / 1,134.10) ≈ NT$841.58 billion
Under that constant-margin assumption, Q2 gross profit would have been approximately NT$841.58 billion.
Actual Q2 gross profit was NT$860.31 billion.
The difference provides a useful arithmetic bridge.
| Gross Profit Bridge | NT$ Billions |
|---|---|
| Q1 reported gross profit | 751.30 |
| Effect of higher revenue at the Q1 margin | +90.28 |
| Additional effect from the improved margin | +18.73 |
| Q2 reported gross profit | 860.31 |
751.30 + 90.28 + 18.73 = 860.31
This calculation suggests that approximately NT$90.28 billion of the NT$109.01 billion increase in gross profit can be represented by applying the earlier margin to higher revenue. The remaining NT$18.73 billion reflects the mathematical effect of the higher realized margin.
There is an important limitation. This bridge is an arithmetic decomposition, not a causal breakdown supplied by TSMC. It cannot assign NT$18.73 billion to a particular combination of pricing, yield, factory utilization, or product mix.
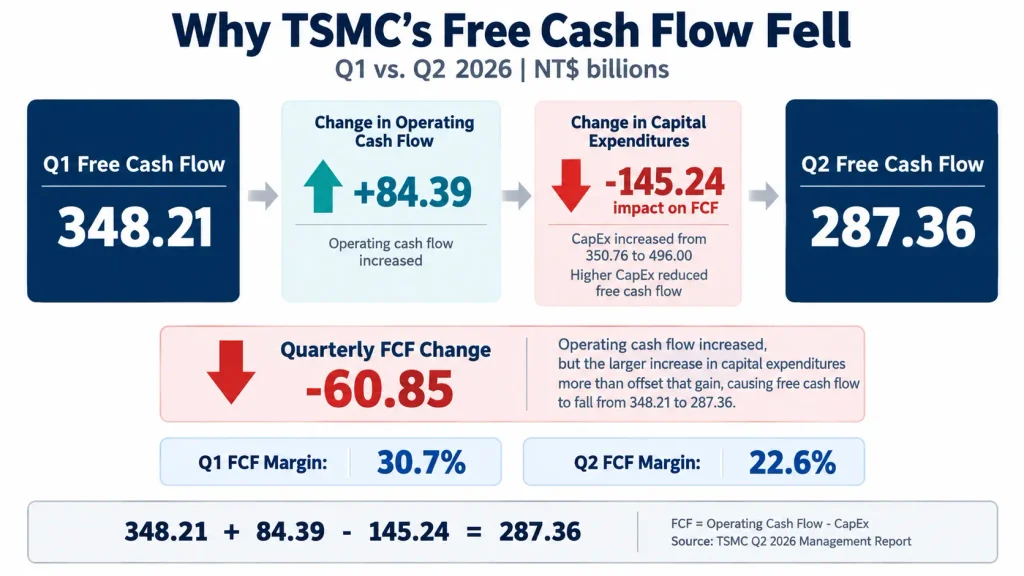
This calculation separates the gross profit change into a constant-margin revenue effect and an additional margin effect. It is an arithmetic decomposition using reported financial statements, not a company-disclosed causal breakdown.
For a broader discussion of how companies convert pricing and production economics into gross profit, see How to Analyze Gross Margin: 4 Essential Drivers Investors Should Check.
Why Wafer Shipments Do Not Tell the Entire Demand Story
Manufacturing volume matters, but a semiconductor investor should be careful about treating wafer shipments as a direct measure of factory utilization.
TSMC reported Q2 wafer shipments of 4.336 million 12-inch-equivalent wafers, compared with 4.174 million in Q1. Shipments increased approximately 3.9%.
Over the same period, reported revenue increased 12.0%.
The gap is worth investigating because it tells investors that changes in physical shipment volume alone do not explain the entire revenue increase.
However, the difference should not automatically be attributed to a 12.0% increase in chip selling prices or to an equivalent improvement in manufacturing productivity.
A foundry serves customers across multiple process technologies and product categories. Wafer revenue can also be affected by product complexity, manufacturing services, technology mix, and customer demand patterns.
Utilization, Production and Shipments Are Different Measures
Factory utilization generally compares actual production activity with available production capacity over a particular period.
Wafer shipments represent output delivered to customers during that reporting period. Differences in production timing, inventories, capacity additions, and the mix of manufacturing processes mean shipments and utilization need not move in identical proportions.
In TSMC’s Q2 2026 earnings discussion, management explicitly identified a slightly higher overall capacity utilization rate and cost improvement efforts as the primary reasons for the sequential improvement in gross margin.
Margin dilution from overseas fabs partially offset those benefits.
That management explanation is more informative than trying to derive an exact factory utilization rate from reported shipments alone.
Investors should also distinguish gross margin effects from operating leverage elsewhere on the income statement. Higher factory utilization can help manufacturing costs, while the growth of research, administrative, and other operating expenses affects operating profit separately.
Advanced-Node Mix Can Improve Revenue While Pressuring Margins
Semiconductor manufacturing is unusual because the introduction of a more advanced product can create two opposing financial effects.
Customers may pay for advanced processing capabilities, particularly when demand for computing performance and power efficiency is strong. At the same time, moving a new process into large-scale production can increase depreciation, engineering costs, and manufacturing complexity.
Early production yields may also differ from those of more mature manufacturing processes.
As a result, stronger leading-edge demand does not guarantee an immediate improvement in gross margin.
What TSMC’s Technology Mix Revealed in Q2 2026
TSMC disclosed a meaningful change in wafer revenue mix between Q1 and Q2 2026.
| Share of Wafer Revenue | Q1 2026 | Q2 2026 |
|---|---|---|
| 2nm | Not separately shown | 3% |
| 3nm | 25% | 30% |
| 7nm and More Advanced | 74% | 77% |
Source: TSMC Q1 2026 quarterly results and TSMC Q2 2026 quarterly results. The advanced-node category includes individual nodes shown above and must not be added to their shares. The Q1 presentation did not separately display a 2nm percentage.
The 3nm share of wafer revenue increased from 25% to 30%. Meanwhile, 2nm accounted for 3% of wafer revenue in Q2, although it was not separately displayed in the Q1 technology-mix presentation.
The technology shift reflects growing adoption of advanced manufacturing processes. Yet the reported shares do not disclose the gross margin earned on each individual node.
It would therefore be incorrect to assume that the larger 3nm or 2nm contribution caused the company’s entire 1.5-percentage-point margin improvement.
TSMC also reported that high-performance computing accounted for 66% of total revenue in Q2, up from 61% in Q1. That is a separate end-market revenue classification, not another process-node percentage. The two breakdowns should not be added together or treated as interchangeable.
For investors, the distinction between physical volume, pricing and sales composition also applies well beyond semiconductors. The general methodology is covered in How to Analyze Revenue Growth: Price vs. Volume vs. Mix.
What TSMC’s July Q3 Margin Guidance Revealed
TSMC’s July 16, 2026 outlook provided another useful example of how manufacturing economics can complicate an otherwise positive revenue narrative.
After reporting Q2 revenue of US$40.20 billion and a 67.7% gross margin, the company guided for Q3 revenue of US$44.6 billion to US$45.8 billion.
At the time, that guidance implied further sequential revenue growth.
However, the company projected a Q3 gross margin range of 65% to 67%, with a midpoint of 66%.
The midpoint was 1.7 percentage points below the Q2 actual gross margin.
During its earnings conference call, management attributed the expected sequential margin pressure primarily to the rapid ramp-up of 2nm manufacturing technology.
Management estimated that the 2nm ramp could dilute gross margin by approximately 3 to 4 percentage points during the second half of 2026. Strong advanced-node demand and manufacturing cost improvements were expected to offset part of that effect.
That estimated dilution is not the same as the net change in consolidated gross margin. Multiple positive and negative factors affect the final result.
The company also discussed ongoing profitability pressure associated with expanding overseas manufacturing operations.
The July Q3 figures were historical guidance, not confirmed Q3 results. They were based in part on an assumed exchange rate of NT$32 per US dollar.
What Was Known by October 8, 2026?
TSMC subsequently released its September 2026 monthly revenue report on October 8.
Combining the reported July, August and September monthly revenue figures gives approximately NT$1,494.24 billion in Q3 revenue. This figure is derived from the company’s monthly disclosures and was available before the full Q3 earnings announcement.
That revenue information provides a more recent view of business activity than the July sales guidance. However, monthly revenue reports do not establish the actual Q3 gross margin, cost of revenue, or free cash flow.
Consequently, the July projection of 65% to 67% should be read as a historical margin forecast rather than a confirmed profitability result.
As of October 12, 2026, TSMC’s full Q3 earnings release was scheduled for October 15, 2026.
Sources: TSMC Q2 earnings conference materials and transcript and TSMC September 2026 revenue report filed with the SEC.
The practical lesson is that an advanced process can contribute to future production capability while putting pressure on near-term profitability. Whether that investment proves attractive depends on production efficiency, customer demand, pricing and the cash returns ultimately generated.
The Cash Flow Test: Did Better Gross Margins Produce More Cash?
Accounting profitability and cash generation are related, but they do not move together every quarter.
Gross margin is an income-statement measure. It reflects the difference between revenue and cost of revenue, including manufacturing expenses recognized during the reporting period.
Free cash flow incorporates a different set of considerations. A commonly used calculation subtracts capital expenditures from operating cash flow.
Calculated FCF = Operating Cash Flow – Capital Expenditures
This distinction is especially relevant for foundries because advanced semiconductor manufacturing requires significant investment in equipment, facilities and production capacity.
TSMC’s Q2 Free Cash Flow Reconciliation
TSMC generated NT$783.36 billion in operating cash flow during Q2 2026, up from NT$698.97 billion in Q1.
Operating cash flow therefore increased by NT$84.39 billion.
Capital expenditures, however, increased from NT$350.76 billion to NT$496.00 billion, a rise of NT$145.24 billion.
| Cash Flow Metric | Q1 2026 | Q2 2026 |
|---|---|---|
| Operating Cash Flow | 698.97 | 783.36 |
| Capital Expenditures | 350.76 | 496.00 |
| Calculated FCF | 348.21 | 287.36 |
| Calculated FCF Margin | 30.7% | 22.6% |
Cash flow amounts are in NT$ billions. The FCF and FCF margin figures are calculated from TSMC’s reported data using operating cash flow minus CapEx. Source: TSMC Q2 2026 Management Report, Cash Flow section.
Here is the direct calculation.
Q1 FCF = 698.97 – 350.76 = NT$348.21 billion
Q2 FCF = 783.36 – 496.00 = NT$287.36 billion
That produces a sequential decline of NT$60.85 billion, or approximately 17.5%.
The entire quarterly change can also be reconciled through operating cash flow and capital spending.
Change in FCF = +84.39 – 145.24 = -NT$60.85 billion
This calculation provides a more precise explanation than describing the quarter as having weaker cash generation. Cash from operations actually increased. The decline in FCF occurred because capital expenditures grew by a larger amount.
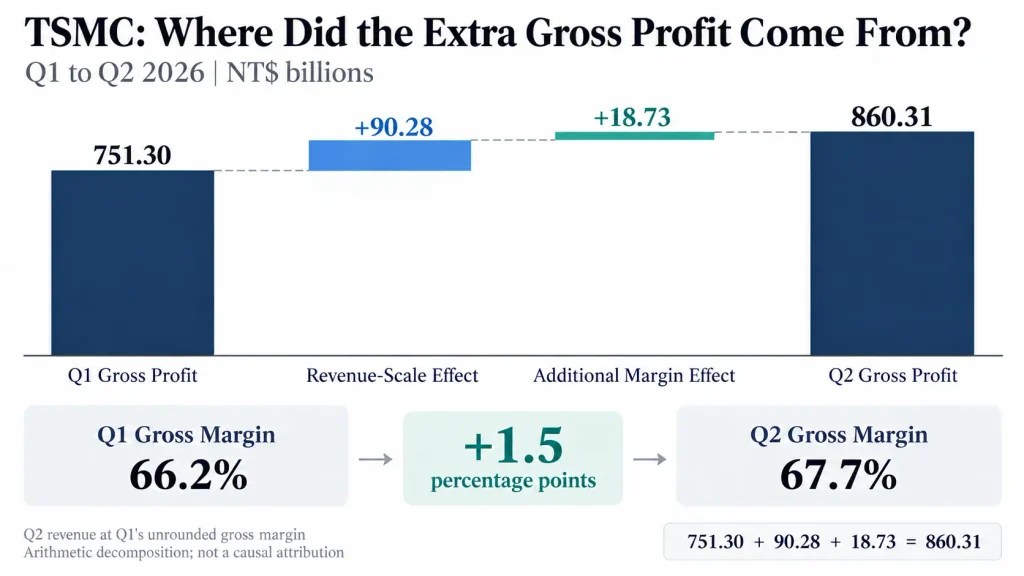
TSMC generated more operating cash in Q2 2026, but the increase in capital expenditures was larger. Using operating cash flow minus CapEx, calculated FCF declined by NT$60.85 billion despite the improvement in gross margin.
FCF Margin Adds Another Perspective
Dividing calculated free cash flow by quarterly revenue adds a useful cash-generation measure.
FCF Margin = Calculated FCF / Revenue × 100
For Q1 2026:
348.21 / 1,134.10 × 100 ≈ 30.7%
For Q2 2026:
287.36 / 1,270.38 × 100 ≈ 22.6%
On this calculation, FCF margin declined by approximately 8.1 percentage points, even as gross margin increased by 1.5 percentage points.
The two measures are not contradictory. They examine different parts of the business.
Gross margin captures revenue after recognized production costs. FCF margin reflects operating cash generation after the capital expenditures included in the calculation.
Investors should also remember that FCF is not a standardized GAAP line item. Definitions may differ across companies and financial data providers, especially when capital spending classifications vary.
A single quarter of lower FCF does not establish that an investment program is failing. It may reflect deliberate spending ahead of future revenue and cash generation. Evaluating those investments requires examining performance over a longer period.
The distinction between maintaining existing assets and investing in future capacity is explored in How CapEx Affects Free Cash Flow: Maintenance vs. Growth CapEx Explained.
How to Evaluate Semiconductor Gross Margin in the Next Earnings Report
TSMC’s Q2 results illustrate why the reported margin percentage should be the beginning of an earnings analysis rather than the final conclusion.
A useful investor review can be organized around four questions.
Has Revenue Growth Outpaced Production Costs?
Compare the growth of revenue, cost of revenue and gross profit over the same reporting period. If gross profit grows faster than revenue, determine whether the improvement comes from identifiable cost or mix changes.
What Does Management Say About Factory Economics?
Look for discussion of utilization, yields, productivity, node conversion, manufacturing capacity and depreciation.
These disclosures are particularly important when shipments grow at a different rate from reported revenue.
Is a New Process Node Helping or Diluting the Margin?
Review the revenue contribution of new process technologies alongside management’s comments on ramp costs. A higher advanced-node revenue share does not reveal the individual node’s profitability.
Is Operating Improvement Converting Into Cash After Investment?
Compare operating cash flow and capital expenditures separately before interpreting the change in FCF. A stronger margin accompanied by lower FCF may have a different explanation from declining operating cash flow caused by weak demand or working-capital pressure.
These questions should also be applied to the appropriate business model. A foundry with large fabrication assets has a different cost structure from a fabless chip designer that outsources production. Memory manufacturers and integrated device manufacturers have their own pricing cycles, inventory considerations and manufacturing economics.
Gross margins across these business models are informative, but not directly interchangeable measures of competitive advantage.
Questions Investors Often Miss
Can Gross Profit Increase Even When Gross Margin Falls?
Yes. The dollar amount of gross profit can increase if revenue expands sufficiently, even when the percentage earned on each dollar of sales declines.
For example, consider a hypothetical company with $100 million in revenue and a 60% gross margin. It earns $60 million of gross profit.
If revenue increases to $130 million while gross margin falls to 55%, gross profit still increases to $71.5 million.
That example illustrates why both gross profit dollars and gross margin percentage matter. The lower margin might reflect cost pressure, a deliberate pricing decision, or changes in product mix. The percentage alone does not establish the cause.
Can Investors Derive a Chipmaker’s Average Selling Price From Wafer Shipment Growth?
Not reliably from shipment growth alone. Reported shipment figures may be expressed in standardized wafer equivalents, while revenue reflects different technologies, products, manufacturing services and customer arrangements.
Dividing total revenue by reported shipments may create a rough blended measure, but it should not be mistaken for the actual selling price of a specific process node or finished chip.
Does a Higher FCF Margin Always Mean a Better Semiconductor Investment?
No. A higher FCF margin may indicate strong cash generation relative to revenue, but capital-intensive businesses can experience periods of lower FCF while building productive capacity.
Investors need to evaluate the expected returns, timing, risks and eventual cash generation of that spending. Historical cash flow, future demand and investment efficiency all matter.
The Investment Takeaway
TSMC’s Q2 2026 results offered three different financial signals.
First, manufacturing profitability improved. Revenue increased 12.0%, cost of revenue rose only 7.1%, and gross margin expanded to 67.7%.
Second, the growth of advanced manufacturing introduced a separate profitability question. The company’s July guidance anticipated near-term margin dilution from accelerating 2nm production even as demand supported higher projected revenue. Subsequently reported Q3 monthly revenue did not, by itself, establish whether that margin outlook was realized.
Third, free cash flow declined because the increase in capital spending exceeded the improvement in operating cash flow.
None of these observations should be evaluated in isolation.
For semiconductor investors, the stronger analytical approach is to connect reported margins to manufacturing capacity, technology mix and the cash required to support future production.
That approach provides a more complete picture of a foundry’s economics than relying exclusively on revenue growth, gross margin, or a single quarter of free cash flow.
Disclaimer: This article is provided for educational and investment research purposes only. It is not a recommendation to buy or sell any security. Financial results and company guidance refer to the reporting periods and announcement dates specified and may change in subsequent disclosures. Investors are responsible for their own investment decisions and associated risks.