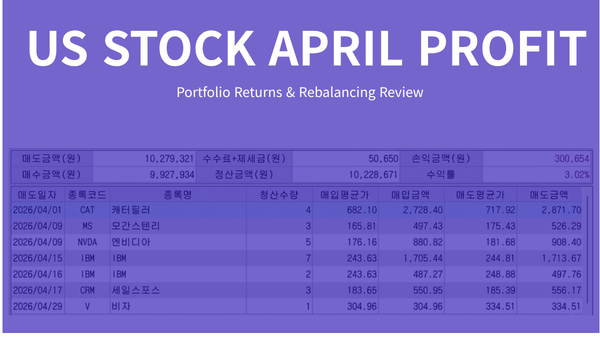
This April 2026 stock trading review is based on an actual brokerage record covering U.S. stock sales completed between April 1 and April 30, 2026. The statement shows seven sell transactions, a net realized profit of KRW 300,654, and a reported realized return of +3.02%. Rather than treating one profitable month as proof of a broader investment strategy, this review looks at what the transaction record actually shows, what can be calculated from it, and which conclusions require additional account data.

April 2026 Stock Trading Review: What the Brokerage Record Shows
The brokerage statement covers transactions from April 1 through April 30, 2026. It reports KRW 10,279,321 in sale proceeds, KRW 9,927,934 in purchase cost, KRW 50,650 in fees and taxes, and KRW 300,654 in net realized profit.
| Item | Brokerage Record |
|---|---|
| Review period | Apr. 1–30, 2026 |
| Sale proceeds | KRW 10,279,321 |
| Purchase cost | KRW 9,927,934 |
| Fees and taxes | KRW 50,650 |
| Net realized profit | KRW 300,654 |
| Reported realized return | +3.02% |
The +3.02% figure applies to the realized transactions included in this statement. It should not be interpreted as the return of the entire account because stocks that remained open at the end of April may have had unrealized gains or losses that are not included here.
Seven Realized Trades: Purchase Price vs. Sale Price
The statement also provides average purchase and sale prices for each transaction. The simple price change below is calculated as (average sale price ÷ average purchase price − 1) × 100. These percentages do not include exchange-rate effects, taxes, or brokerage fees.
| Date | Ticker | Shares | Avg. Purchase | Avg. Sale | Price Change |
|---|---|---|---|---|---|
| Apr. 1 | CAT | 4 | $682.10 | $717.92 | +5.25% |
| Apr. 9 | MS | 3 | $165.81 | $175.43 | +5.80% |
| Apr. 9 | NVDA | 5 | $176.16 | $181.68 | +3.13% |
| Apr. 15 | IBM | 7 | $243.63 | $244.81 | +0.48% |
| Apr. 16 | IBM | 2 | $243.63 | $248.88 | +2.15% |
| Apr. 17 | CRM | 3 | $183.65 | $185.39 | +0.95% |
| Apr. 29 | V | 1 | $304.96 | $334.51 | +9.69% |
Visa had the largest simple price increase at about +9.69%, followed by Morgan Stanley at +5.80% and Caterpillar at +5.25%. That ranking does not necessarily match each trade’s contribution to the monthly realized profit because position size matters. Visa involved one share, while Caterpillar involved four.
Why Price Return and Realized Account Profit Can Differ
The trade-level percentages above use U.S. dollar purchase and sale prices only. The realized result reported in Korean won can also be affected by the number of shares sold, exchange rates, transaction fees, taxes, and the brokerage firm’s settlement methodology.
This April 2026 stock trading review therefore does not attempt to reverse-engineer a separate KRW profit for every transaction from the price data alone. The brokerage statement provides the monthly realized total, while the trade table is used only to compare price movements.
What the April Statement Cannot Prove by Itself
A realized-gain report is useful, but it does not answer every portfolio question. This statement alone cannot establish whether the portfolio’s drawdown matched the S&P 500, what percentage of the account was held in cash, or whether every dollar of dividend income was reinvested.
Those conclusions require additional evidence. A volatility comparison needs a time series of total account values, cash allocation requires complete balance records, and dividend reinvestment requires both distribution records and subsequent purchase history. A useful monthly review should separate what the account records document from what would require further evidence.
Rebalancing Is Different From Simply Selling a Winner
Selling a profitable position is not automatically portfolio rebalancing. Investor.gov’s asset allocation and diversification guide explains that market movements can push a portfolio away from its intended allocation and that restoring the original mix may involve selling part of an overweight asset, investing additional money in other asset categories, or both.
Without documented target weights before and after each trade, the April statement can confirm that shares were sold but cannot by itself establish that each sale was a formal rebalancing transaction.
Three Lessons From the April Trading Record
1. Realized return and total portfolio return should be tracked separately
The reported +3.02% covers realized trades. Open positions can move in the opposite direction during the same period, so a complete monthly review should distinguish realized results from unrealized gains and losses.
2. Percentage return needs position-size context
A large percentage gain on a small position can contribute less money than a modest gain on a larger position. Reviewing both percentage return and capital exposure gives a clearer picture of what actually drove the account result.
3. Trade reasoning is most useful when recorded at the time of the decision
The brokerage record shows dates, prices, quantities, and results, but it does not fully reconstruct the reasoning behind every sale. Recording the original reason for a reduction, the intended position size, and any portfolio limit at the time of execution makes later reviews more useful and reduces hindsight bias.
How the Monthly Review Process Evolved
Later portfolio reviews on Smart Asset Desk use more detailed execution data to separate closed-trade results from the remaining portfolio. The August 2026 systematic portfolio review, for example, records quantities, average purchase prices, average sale prices, and realized results for individual trades.
For readers more interested in ongoing contributions and target weights than individual stock exits, the September 2026 asset allocation DCA portfolio review presents a different type of monthly record centered on planned asset weights and actual purchase amounts.
Used this way, an April 2026 stock trading review becomes more than a monthly profit snapshot. It provides a record of what was realized, what still remained open, and which parts of the investment process can be evaluated from evidence rather than hindsight.
Investment Disclaimer
This publication is prepared for educational and research purposes and does not constitute financial advice or a recommendation to buy or sell securities. The figures discussed here refer to a historical brokerage record and do not predict future results. Investors are responsible for their own research, decisions, and investment outcomes.