
The Broadcom 200 day moving average can help investors evaluate the longer-term direction of AVGO stock, but it cannot establish a guaranteed support price or determine whether the shares are undervalued.
A useful Broadcom 200 day moving average analysis combines price trends, RSI momentum, and the company’s operating performance without treating any one indicator as an automatic buying signal. Moving averages describe historical prices. RSI measures recent price momentum. Neither directly measures the value of Broadcom’s semiconductor and infrastructure software businesses.
This analysis revisits an archived September 2026 technical chart, explains how to interpret its limitations, and compares the market narrative with Broadcom’s verified fiscal third-quarter 2026 cash flow.
Research takeaway
A stock trading near its 200-day moving average may be testing an important historical trend reference, but the average is not a price floor. Broadcom’s FY2026 third-quarter cash flow improved substantially from the prior-year period. That improvement provides useful business context, not confirmation that a particular technical support level will hold.
Broadcom 200 Day Moving Average: What It Actually Measures
The 200-day moving average summarizes roughly 200 trading sessions of historical prices. Investors commonly use it to compare the current market price with a longer-term trend.
Two versions are frequently discussed: the simple moving average (SMA) and the exponential moving average (EMA). They measure related but different aspects of the same price history.
200-Day Simple Moving Average
The 200-day SMA is calculated by adding the closing prices from 200 trading sessions and dividing the total by 200.
200-Day SMA = Sum of 200 Daily Closing Prices ÷ 200
Each observation receives equal weight. As a result, the average changes gradually as new closing prices replace older observations.
The SMA can help investors recognize whether the current market price is above or below a longer-term historical reference.
However, the average does not reveal the purchase prices of institutional shareholders, the fair value of a business, or a guaranteed level of market demand.
200-Day Exponential Moving Average
The 200-day EMA places greater weight on more recent prices. It therefore may respond more quickly than the SMA to changes in market direction.
A standard EMA calculation uses a smoothing multiplier:
EMA Multiplier = 2 ÷ (200 + 1) ≈ 0.00995
The current EMA is calculated using the newest price and the preceding EMA value. The starting value and amount of available historical data can affect the result.
A 200-day EMA should not be described interchangeably with a 200-day SMA. Investors comparing technical values must establish which method was used.
The calculation also depends on price adjustments, the data provider, the observation date, and how historical prices are handled following corporate actions such as stock splits.
Reading the Archived September 2026 AVGO Chart
An earlier version of this analysis identified a moving-average reference near $370–$372, an RSI reading near 35, and a lower support range around $335–$351.
Those figures came from an archived technical presentation. The underlying daily price data, indicator initialization, and independently reproducible calculations were not documented sufficiently to establish them as verified support or trading signals.
They are therefore historical research references rather than current market recommendations.
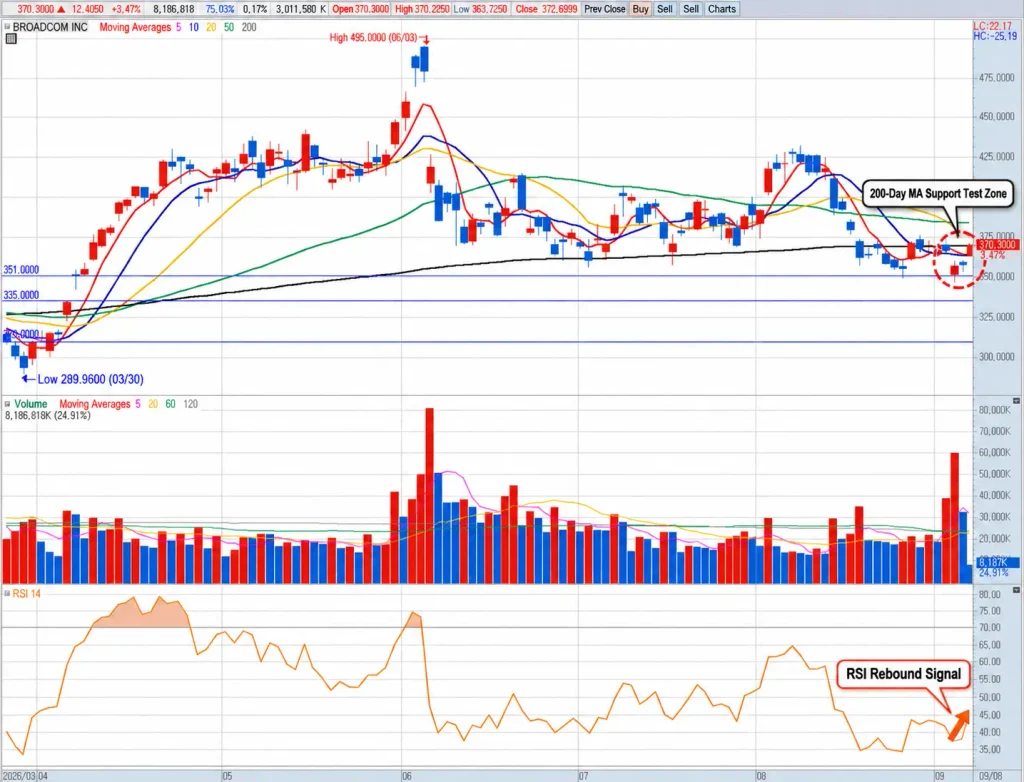
The important distinction is between observing a historical price relationship and claiming that the relationship will continue.
A stock can move below its long-term average and keep declining. It can also recover above that average without establishing a durable new uptrend.
Moving averages describe price behavior after it has occurred. They cannot establish which future direction the market will take.
RSI and the 200-Day Moving Average Answer Different Questions
The Relative Strength Index (RSI) measures the magnitude of recent upward and downward price changes on a scale from 0 to 100.
The conventional 14-period RSI uses a selected series of price observations. Daily RSI(14) and weekly RSI(14) examine different time horizons.
Readings below 30 are commonly labeled oversold, while readings above 70 are commonly labeled overbought. Neither threshold establishes a stock’s intrinsic value.
A reading near 35 may indicate relatively weak recent momentum, but it does not independently confirm that selling pressure has ended.
Investors can combine RSI observations with a longer-term moving average to investigate market conditions, provided both indicators are calculated from a defined price series and observation date.
| Observation | Possible Meaning | Limitation |
|---|---|---|
| Price below a rising 200-day average | A pullback against the longer-term historical trend | The decline may deepen and the average may turn lower |
| Price below a falling 200-day average | Weakness relative to a declining historical trend | No reliable bottom is established |
| RSI below 30 | Recent downward momentum is pronounced | The stock can remain oversold while declining |
| RSI rises as price stabilizes | Selling momentum may be moderating | A lasting reversal still requires additional evidence |
These are analytical possibilities, not statistically validated Broadcom trading signals.
For a fuller examination of why momentum indicators can produce false reversal signals, see our RSI Oversold Strategy analysis using NVIDIA. The interpretation principles can be useful across securities, although the results of any technical strategy must be evaluated separately.
Broadcom FY2026 Q3: The Fundamental Cash Flow Cross-Check
A moving average says nothing directly about a company’s cash generation. To evaluate whether the underlying business is strengthening, investors must examine its financial statements and operating performance.
Broadcom’s official September 2, 2026 earnings release reported results for the fiscal quarter ended August 2, 2026.
The company generated $29.591 billion of revenue, $14.197 billion in operating cash flow and $13.665 billion of free cash flow under its disclosed calculation.
The corresponding prior-year quarter provides a useful comparison.
| Financial Metric | FY2025 Q3 | FY2026 Q3 | Change |
|---|---|---|---|
| Revenue | $15.952B | $29.591B | +85.50% |
| Operating Cash Flow | $7.166B | $14.197B | +98.12% |
| Cash Capital Expenditures | $0.142B | $0.532B | +$0.390B |
| Free Cash Flow | $7.024B | $13.665B | +94.55% |
| FCF Margin | 44.03% | 46.18% | +2.15 percentage points |
Source: Broadcom FY2026 third-quarter earnings release. Figures are converted from USD millions to billions. Growth rates and FCF margins are calculated from reported amounts and rounded to two decimal places.
The company’s disclosed FCF reconciliation subtracts purchases of property, plant and equipment from operating cash flow.
FY2025 Q3 FCF = $7.166B − $0.142B = $7.024B
FY2026 Q3 FCF = $14.197B − $0.532B = $13.665B
Despite an increase in capital expenditures, operating cash flow grew sufficiently for FCF to rise by $6.641 billion year over year.
The FCF margin also improved from approximately 44.03% to 46.18%. This represents an increase of roughly 2.15 percentage points.
Broadcom’s free cash flow is a non-GAAP financial measure, and investors should review the company’s disclosed reconciliation rather than assume all businesses calculate FCF identically.
For more detail on the role of the revenue denominator and capital expenditures, see How to Calculate Free Cash Flow Margin.
What These Results Support—and What They Do Not
The reported results support the conclusion that Broadcom generated substantially more operating cash flow and free cash flow in FY2026 Q3 than in FY2025 Q3.
They do not establish that AVGO shares are undervalued at a specific market price.
Shareholder returns depend on expectations for future earnings, the price paid for those earnings, financing and capital-allocation decisions, and the market’s willingness to maintain or change its valuation multiple.
A business can deliver strong revenue growth while its stock declines because the market previously priced in even stronger results.
The cash-flow comparison therefore belongs alongside technical analysis, not underneath it as an assumed guarantee of price support.
Can the Original $350–$370 Accumulation Range Be Reused?
The earlier analysis discussed an initial $350–$370 range and a lower $335–$351 zone.
Those were historical reference levels identified in the original article. Without verified price-series calculations, they cannot be established as statistically meaningful present-day support zones.
A moving average also changes with each new trading session. A price range tied to the average at one point cannot be assumed to remain relevant months later.
Investors evaluating an updated technical reference should establish the following information before attaching significance to any dollar amount:
- Observation date: Identify the exact trading session to which the technical value applies.
- Price data: Obtain a reliable daily historical price series, including the treatment of stock splits and other adjustments.
- Indicator definition: Distinguish the 200-day SMA from the 200-day EMA and specify any RSI calculation settings.
- Price structure: Examine previous reactions, trend direction, volume and relevant consolidation areas.
- Fundamental context: Compare price behavior with earnings, cash flow, guidance and material business developments.
Even when all five elements are documented, the resulting level remains a technical observation rather than a guaranteed price floor.
Why the Earlier Execution Example Requires Caution
The original article also contained a formatted tracking panel showing an assumed $360.00 cost basis and a $370.88 market price.
However, the panel’s displayed gain of $9.06 and return of 2.51% did not reconcile with those two prices.
For one share purchased at exactly $360.00 and valued at $370.88, the simple calculation would be:
Price difference = $370.88 − $360.00 = $10.88
Price-only return = $10.88 ÷ $360.00 × 100 ≈ 3.02%
This calculation excludes commissions, taxes, currency conversion and other account adjustments.
Because the original panel contained inconsistent figures and its underlying execution record was not independently verified, it is not reproduced as a confirmed brokerage transaction in this revision.
This correction does not establish that a trade did or did not occur. It separates a mathematical price illustration from an authenticated record of execution.
How to Use Moving Averages Without Treating Them as Buy Orders
For a long-term shareholder, technical indicators may provide context about recent market behavior. They should not independently determine whether more capital is committed to a business.
A practical review can separate three questions.
Is the Trend Changing?
Start with the direction of the 200-day moving average and the relationship between price and the average.
A flattening or declining long-term average may indicate that the historical trend has weakened. A recovery above the average may suggest improving price behavior, but follow-through and additional data are needed before interpreting it as a durable shift.
Does Momentum Support the Price Observation?
RSI can show whether recent price changes are becoming more or less one-sided.
An oversold reading followed by a rebound may warrant further investigation, but the price can still establish new lows afterward.
A technical assessment should therefore examine actual price behavior rather than rely exclusively on the oscillator.
Does the Business Justify Additional Risk?
Strong operating performance can support a long-term investment case, but it does not eliminate valuation and concentration risk.
Broadcom’s AI semiconductor exposure, infrastructure software operations, capital allocation and cash-flow conversion are relevant to evaluating the business.
Our ROIC Investing Strategy explains how operating returns and capital requirements can be assessed separately from stock-price movements.
Investors should also review how much exposure they already have to semiconductor, AI infrastructure and related technology businesses before considering additional single-stock concentration.
Frequently Asked Questions
Is the Broadcom 200-day moving average a reliable support level?
It is a historical trend reference, not a guaranteed support level. Prices can move through the average and remain on either side for extended periods. Its relevance depends on the observation date, price history, calculation method and market conditions.
Does RSI recovering from 35 confirm an AVGO stock reversal?
No. A recovering RSI can indicate moderating downward momentum, but it does not independently confirm a durable price reversal. Investors should check the underlying price trend and determine whether the indicator was calculated from verified market data.
Does Broadcom’s stronger free cash flow make its stock safer to buy?
Higher cash flow can improve the financial picture of a business, but it does not guarantee a favorable stock return. Investors must also consider the purchase price, future growth expectations, debt obligations, competition and changes in valuation.
Bottom Line
The Broadcom 200 day moving average can help organize a historical trend review, but it cannot establish where the stock must stop falling.
Broadcom’s FY2026 third-quarter results provide a stronger foundation for fundamental analysis: the company generated $13.665 billion of free cash flow, compared with $7.024 billion in the prior-year quarter, under its disclosed definition.
That improvement is meaningful financial evidence. It should not be confused with proof that an old technical support range remains valid.
Investors can make more informed assessments by verifying the observation date and methodology of their technical indicators, examining official financial results, and keeping price observations separate from actual transaction records and valuation conclusions.
Investment Disclaimer
This article is provided for educational and investment research purposes only and does not constitute a recommendation to buy or sell Broadcom shares or any other security. Historical prices, technical indicators, financial data and company guidance may change or become outdated. Investors are responsible for their own decisions and investment outcomes.