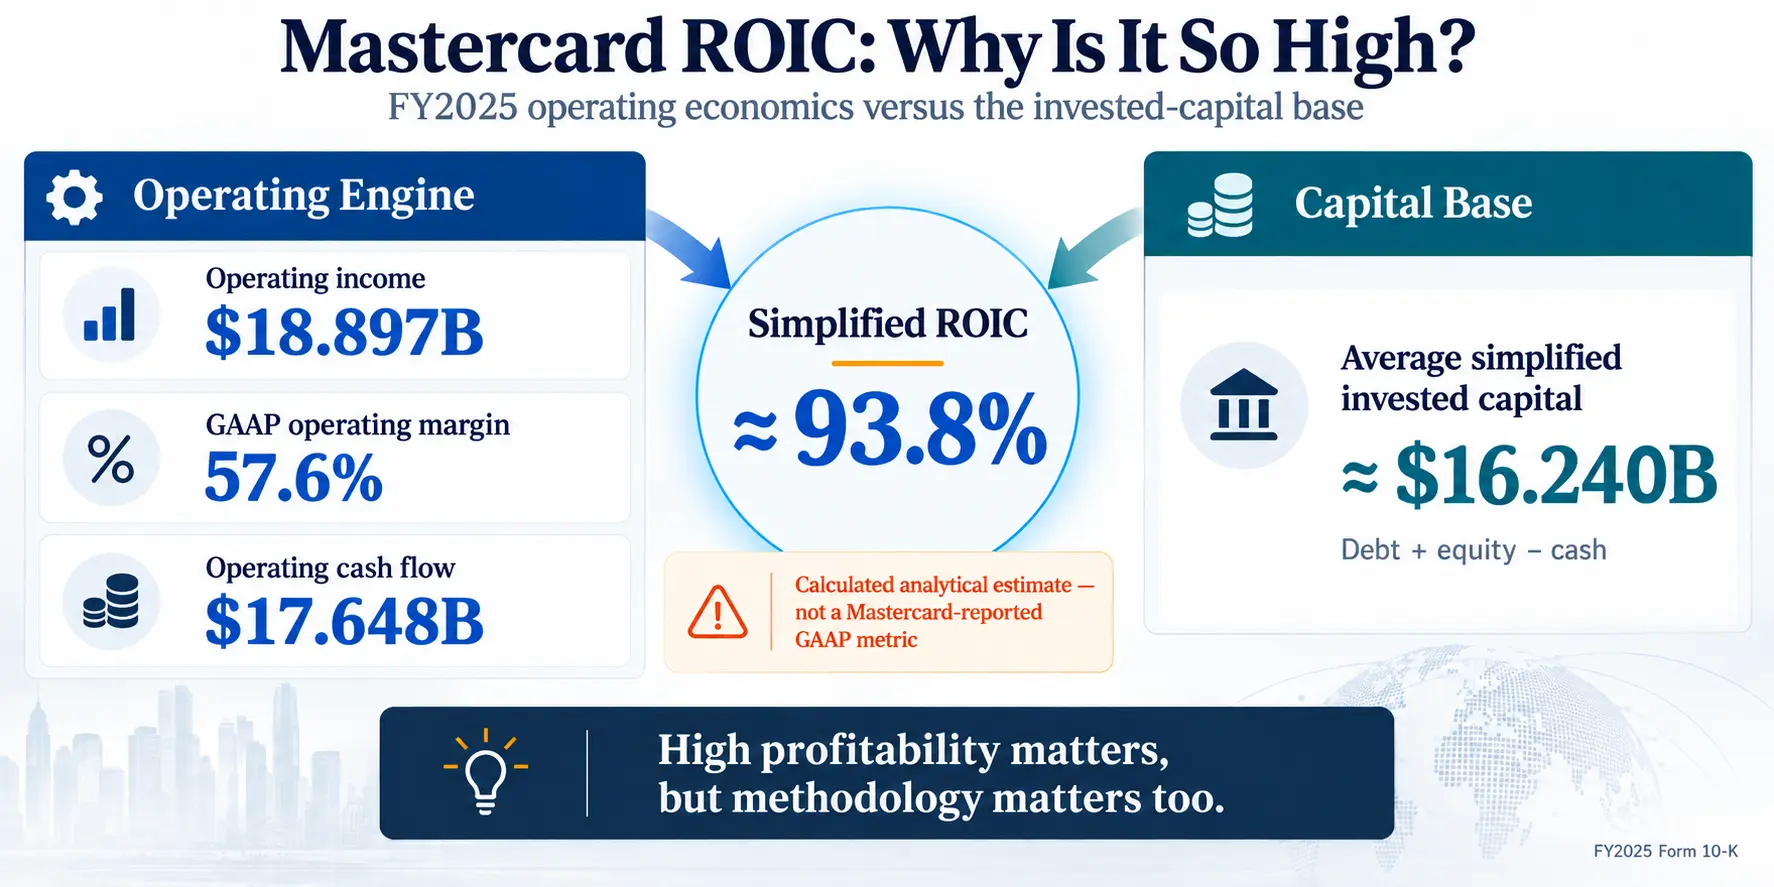
Mastercard ROIC can look almost implausibly high when the calculation is built from the company’s FY2025 financial statements. Using a simplified approach, estimated NOPAT of about $15.231 billion divided by average invested capital of roughly $16.240 billion produces an ROIC near 93.8%.
That number is useful, but not because investors should treat 93.8% as a precise, company-reported economic return. Mastercard does not report ROIC as a GAAP metric, and the result can change materially depending on how an analyst treats cash, leases, goodwill, acquired intangible assets, and taxes.
The more useful question is whether the business economics still look exceptional after those limitations are acknowledged. In Mastercard’s case, the answer starts with a 57.6% FY2025 GAAP operating margin, $17.648 billion of operating cash flow, and a payment-network model that does not require the company to fund cardholder loans.
A high ROIC estimate is most useful as a signal to investigate the business model, not as a standalone valuation score. Mastercard’s filing suggests that strong operating profitability and relatively modest capital requirements are real, even though the exact ROIC percentage depends on methodology.
Readers who want the conceptual foundation first can review ROE vs. ROIC and capital efficiency. The distinction matters here because Mastercard’s large share repurchases affect book equity and ROE differently from the simplified invested-capital formula used in this analysis.
Start With the 93.8% Mastercard ROIC Calculation
The cleanest way to understand the result is to separate the numerator from the denominator.
For this analysis, the simplified equations are:
ROIC = Estimated NOPAT ÷ Average Invested Capital
Estimated NOPAT = Operating Income × (1 − GAAP Effective Tax Rate)
Simplified Invested Capital = Debt + Total Equity − Cash and Cash Equivalents
These formulas are analytical choices rather than a standardized Mastercard disclosure. Their value is transparency: every major input can be traced back to the company’s Form 10-K.
| ROIC Input | FY2024 / 2024 Year-End | FY2025 / 2025 Year-End | How It Is Used |
|---|---|---|---|
| Operating income | $15.582B | $18.897B | FY2025 NOPAT starting point |
| GAAP effective tax rate | 15.6% | 19.4% | Applied to FY2025 operating income |
| Debt | $18.226B | $19.000B | Included in invested capital |
| Total equity | $6.515B | $7.746B | Included in invested capital |
| Cash and cash equivalents | $8.442B | $10.566B | Fully deducted in this simplified method |
Applying the FY2025 GAAP effective tax rate to operating income gives the following simplified NOPAT estimate:
$18.897B × (1 − 19.4%) ≈ $15.231B
Invested capital at the end of 2024 is:
$18.226B + $6.515B − $8.442B = $16.299B
At the end of 2025:
$19.000B + $7.746B − $10.566B = $16.180B
The two-period average is approximately:
($16.299B + $16.180B) ÷ 2 ≈ $16.240B
That produces the simplified Mastercard ROIC estimate:
$15.231B ÷ $16.240B ≈ 93.8%
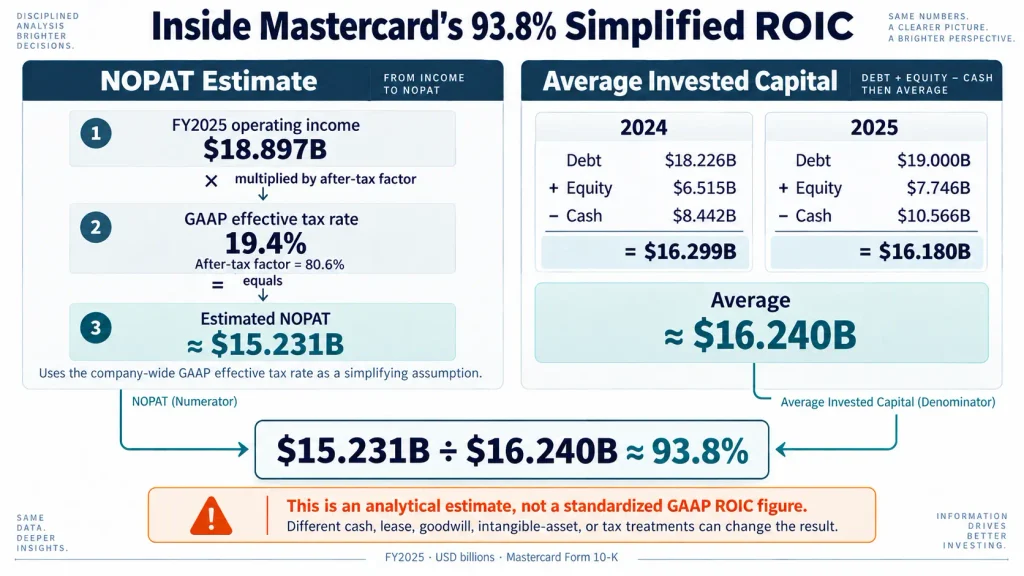
This simplified ROIC rebuild separates the earnings numerator from the invested-capital denominator. The 93.8% result depends heavily on treating all cash as deductible from invested capital and applying the company-wide GAAP effective tax rate to operating income.
The Business Model Explains More Than the Headline Ratio
Mastercard’s economics are easier to understand once the company is separated from a traditional card lender.
In its FY2025 Form 10-K, Mastercard states that it is not a financial institution. It does not issue cards, extend credit to cardholders, or earn the interest rates and cardholder fees set by issuing banks.
Instead, the company operates a global payments network connecting issuers, acquirers, merchants, and account holders. That distinction matters for capital efficiency. A lender generally has to fund or finance a growing asset base as credit expands. Mastercard can process additional payment activity across an existing network without putting the full dollar value of those transactions on its own balance sheet.
FY2025 revenue provides another clue. Payment-network revenue reached $19.476 billion, while value-added services and solutions contributed $13.315 billion.
| FY2025 Evidence | Result | Why It Matters for Capital Efficiency |
|---|---|---|
| Net revenue | $32.791B | Provides the scale against which margins and cash conversion can be tested |
| GAAP operating margin | 57.6% | Shows how much operating profit remains after the operating cost base |
| Operating cash flow | $17.648B | Confirms that a large portion of reported profitability is converting into cash |
| Property and equipment purchases | $0.489B | Relatively modest cash requirement versus the revenue base |
| Capitalized software | $0.726B | Highlights that the network still requires continuing technology investment |
The value-added services and solutions category grew 23% on a reported basis in 2025 versus 12% growth in payment-network revenue. That 23% figure needs context: Mastercard reported 21% currency-neutral growth, and acquisitions contributed 3 percentage points to reported growth. The entire increase should not be treated as purely organic.
The broader point is that Mastercard is building revenue streams around security, authentication, consumer engagement, data, processing, and other services while maintaining the economics of a scaled network.
That makes Mastercard a useful companion to the Visa operating leverage analysis. The two companies are not identical, but both show why payment networks should be analyzed differently from lenders, manufacturers, or other capital-heavy businesses.
Cash Conversion Provides a Stronger Reality Check
An unusually high ROIC becomes less convincing if accounting profit does not convert into cash. Mastercard’s FY2025 cash-flow statement provides a useful cross-check.
Operating cash flow was $17.648 billion against $32.791 billion of net revenue. That is an operating-cash-flow margin of approximately 53.8%.
$17.648B ÷ $32.791B ≈ 53.8%
Mastercard also spent $489 million on property and equipment and $726 million on capitalized software during the year. Combined, those two cash outflows were $1.215 billion, or about 3.7% of net revenue.
($0.489B + $0.726B) ÷ $32.791B ≈ 3.7%
Subtracting both items from operating cash flow leaves a simple cash-flow remainder of approximately $16.433 billion.
$17.648B − $0.489B − $0.726B = $16.433B
That equals roughly 50.1% of revenue. This is an analytical cash-flow cross-check, not a Mastercard-reported GAAP free cash flow figure. Different analysts may classify capitalized software or other investments differently.
For a broader explanation of why definitions matter, see the Smart Asset Desk guide to free cash flow margin.
Capital-light should also not be confused with investment-free. Mastercard still spends heavily on technology, cybersecurity, personnel, customer incentives, acquisitions, and network resilience. The relevant question is whether those investments require capital to rise as quickly as operating profit and cash flow.
Buybacks Can Distort ROE Without Explaining ROIC the Same Way
Mastercard’s balance sheet contains an unusually large treasury-stock balance. At the end of 2025, retained earnings were $85.035 billion while Class A treasury stock carried a negative balance of $83.224 billion. Total equity was only $7.746 billion.
The cash-flow statement also shows $11.727 billion of treasury-stock purchases during FY2025, compared with $2.756 billion of cash dividends.
Those repurchases matter when investors analyze ROE. A cash-funded buyback reduces book equity, so the denominator in ROE = Net Income ÷ Average Equity can fall even if the economics of the underlying operating business have not improved by the same amount.
The simplified ROIC equation used in this article behaves differently:
Invested Capital = Debt + Equity − Cash
If a company spends $1 of existing cash on a repurchase, equity generally falls by $1 and cash also falls by $1. In this specific formula, the lower equity reduces invested capital, but the smaller cash deduction increases it by the same amount. If debt and other relevant items do not change, the two effects can offset.
That means Mastercard’s large buyback program is an important reason to be cautious with ROE, but it is not sufficient by itself to explain the 93.8% ROIC estimate used here.
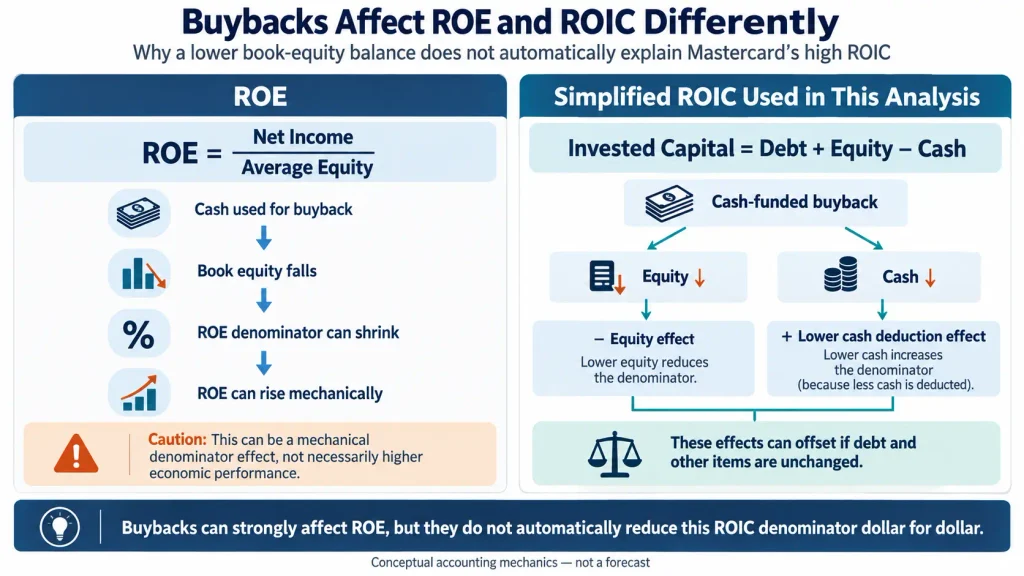
A cash-funded repurchase directly reduces book equity, which can mechanically raise ROE. Under the simplified ROIC formula used here, equity and cash fall together, so the two changes can offset rather than reducing invested capital dollar for dollar.
Why the 93.8% Figure Should Not Be Treated as Precise
The calculation is internally consistent, but several methodological choices can move the final percentage.
| Methodology Choice | Why It Matters | Likely Effect |
|---|---|---|
| Deducting all cash | Some cash may be required for operations, settlement exposure, or liquidity | Can make invested capital too small and ROIC too high |
| Using the GAAP effective tax rate on EBIT | The company-wide tax rate includes geographic and other tax effects that do not perfectly map to operating profit | Changes estimated NOPAT |
| Lease treatment | Some ROIC methodologies capitalize operating lease obligations | Can increase invested capital and reduce ROIC |
| Goodwill and acquired intangibles | Analysts differ on whether acquisition-created assets should remain in the operating capital base | Can materially change peer comparisons |
The tax assumption deserves particular attention. Mastercard’s GAAP effective tax rate rose from 15.6% in 2024 to 19.4% in 2025. The company attributed the increase primarily to a change in the net tax effect of its Singapore operations, including the 15% global minimum-tax rules that took effect in 2025. A change in the geographic mix of earnings also contributed to the increase, partially offset by net discrete tax benefits.
That does not invalidate the NOPAT estimate. It does show why a one-year company-wide tax rate should be treated as a practical approximation rather than a permanent normalized operating tax rate.
The 2026 Results Still Support the Margin Thesis
FY2025 provides the complete annual period needed for the ROIC calculation, but investors can use the first half of 2026 as a separate durability check.
According to Mastercard’s Form 10-Q for the six months ended June 30, 2026, net revenue reached $17.675 billion, up 15% from the prior-year period. Operating income increased 18% to $10.494 billion.
GAAP operating margin was 59.4%, up from 58.0% in the comparable 2025 period.
That does not justify mixing a six-month income statement with year-end FY2025 balance-sheet inputs to create a new annual ROIC figure. It does, however, provide evidence that the high-margin operating model had not disappeared immediately after FY2025.
This distinction between current evidence and period-matched calculation is important. Newer numbers are not automatically better inputs if the numerator and denominator no longer cover compatible periods.
A High ROIC Only Matters if the Company Can Keep Reinvesting Well
ROIC is most useful when it is connected to the cost of capital and to future investment opportunities.
The Smart Asset Desk guide to ROIC vs. WACC explains the basic hurdle: returns above the estimated cost of capital can create economic value, while returns below that hurdle can destroy value if the gap persists.
This article does not assign Mastercard a single current WACC. WACC depends on market-based assumptions such as the risk-free rate, equity risk premium, beta, borrowing cost, and capital structure. Presenting an arbitrary point estimate beside an already methodology-sensitive ROIC would create false precision.
For Mastercard, the more useful forward-looking questions are:
- Can payment-network and value-added-services growth continue without a proportional increase in the capital base?
- Can operating margins remain high as customer incentives, personnel, technology, and security spending rise?
- Will acquisitions produce attractive returns on the additional capital committed?
- Can new payment technologies be incorporated into Mastercard’s network rather than bypass it?
- Does incremental capital continue to generate returns comfortably above the company’s cost of capital?
Historical ROIC describes what the existing business has achieved under a particular calculation. Long-term compounding depends more heavily on the return earned on the next dollar that management invests.
What Could Weaken Mastercard’s Capital Efficiency?
Network-fee and payments regulation
Mastercard operates across jurisdictions with different rules governing payments, competition, data, and network fees. Regulatory pressure can affect pricing economics, routing, customer relationships, and the cost of operating the network.
Alternative payment rails
Real-time account-to-account payments, digital wallets, stablecoins, and other payment technologies can create competition for traditional card-network activity. They can also become opportunities if Mastercard participates in or connects those payment flows through its own services.
Customer incentives
The network benefits from scale, but large issuers, acquirers, merchants, and other customers also have bargaining power. Mastercard disclosed that payment-network net revenue included $20.522 billion of rebates and incentives provided to customers in 2025, up 16% from the prior year. Investors should monitor whether incentive growth absorbs an increasing share of underlying network economics.
Acquisition returns
Value-added services can expand Mastercard’s addressable market, but acquisition-driven growth also introduces goodwill, intangible assets, integration costs, and the risk that acquired businesses earn lower returns than the core network.
Valuation risk
A high ROIC business is not automatically an undervalued stock. Investors can pay a price that already assumes years of superior growth and returns. ROIC measures business economics; valuation determines how much of those economics the market price already reflects.
Bottom Line: Mastercard’s ROIC Is More Useful as a Business-Quality Signal
The simplified FY2025 calculation produces a Mastercard ROIC of approximately 93.8%, but the exact percentage should not be treated as a universal answer.
The denominator deducts all cash, the NOPAT estimate applies the company-wide GAAP tax rate to operating income, and alternative treatments for leases, goodwill, intangible assets, and operating liquidity would produce different results.
What survives those methodological questions is more important. Mastercard generated a 57.6% FY2025 GAAP operating margin, converted more than half of revenue into operating cash flow, and required relatively modest property, equipment, and capitalized-software cash spending relative to its revenue base.
Mastercard itself does not directly fund cardholder credit, allowing transaction and service growth to scale differently from a traditional lender’s asset base.
For investors, that makes the 93.8% figure a starting point rather than the investment thesis. The deeper question is whether Mastercard can continue earning high incremental returns while protecting its network economics against regulation, competition, higher incentives, and less productive capital allocation.
Frequently Asked Questions
Why do websites report different Mastercard ROIC numbers?
ROIC is not a standardized GAAP metric. Data providers may use different definitions for operating cash, leases, goodwill, acquired intangible assets, debt, and tax rates. Two calculations can use the same financial statements and still produce materially different ROIC figures.
Are share buybacks the main reason Mastercard’s ROIC is so high?
Not under the simplified formula used in this article. Cash-funded buybacks reduce book equity, which can mechanically increase ROE. But when invested capital is calculated as debt plus equity minus cash, equity and cash can decline together and offset each other. Mastercard’s high ROIC is better examined through operating profitability, cash generation, capital requirements, and the specific invested-capital methodology.
Does a 90%+ ROIC mean Mastercard stock is cheap?
No. ROIC measures the return generated by the business relative to invested capital. It does not measure whether the stock price is attractive. Valuation still depends on future growth, cash flow, competitive risk, interest rates, and the price investors are paying for those expected returns.
This article is for educational and research purposes only and is not a recommendation to buy or sell any security. Financial data and business conditions may change after the periods discussed. Investors are responsible for their own investment decisions and outcomes.