Net Debt Explained: A Practical Guide to a Company’s Real Debt Burden
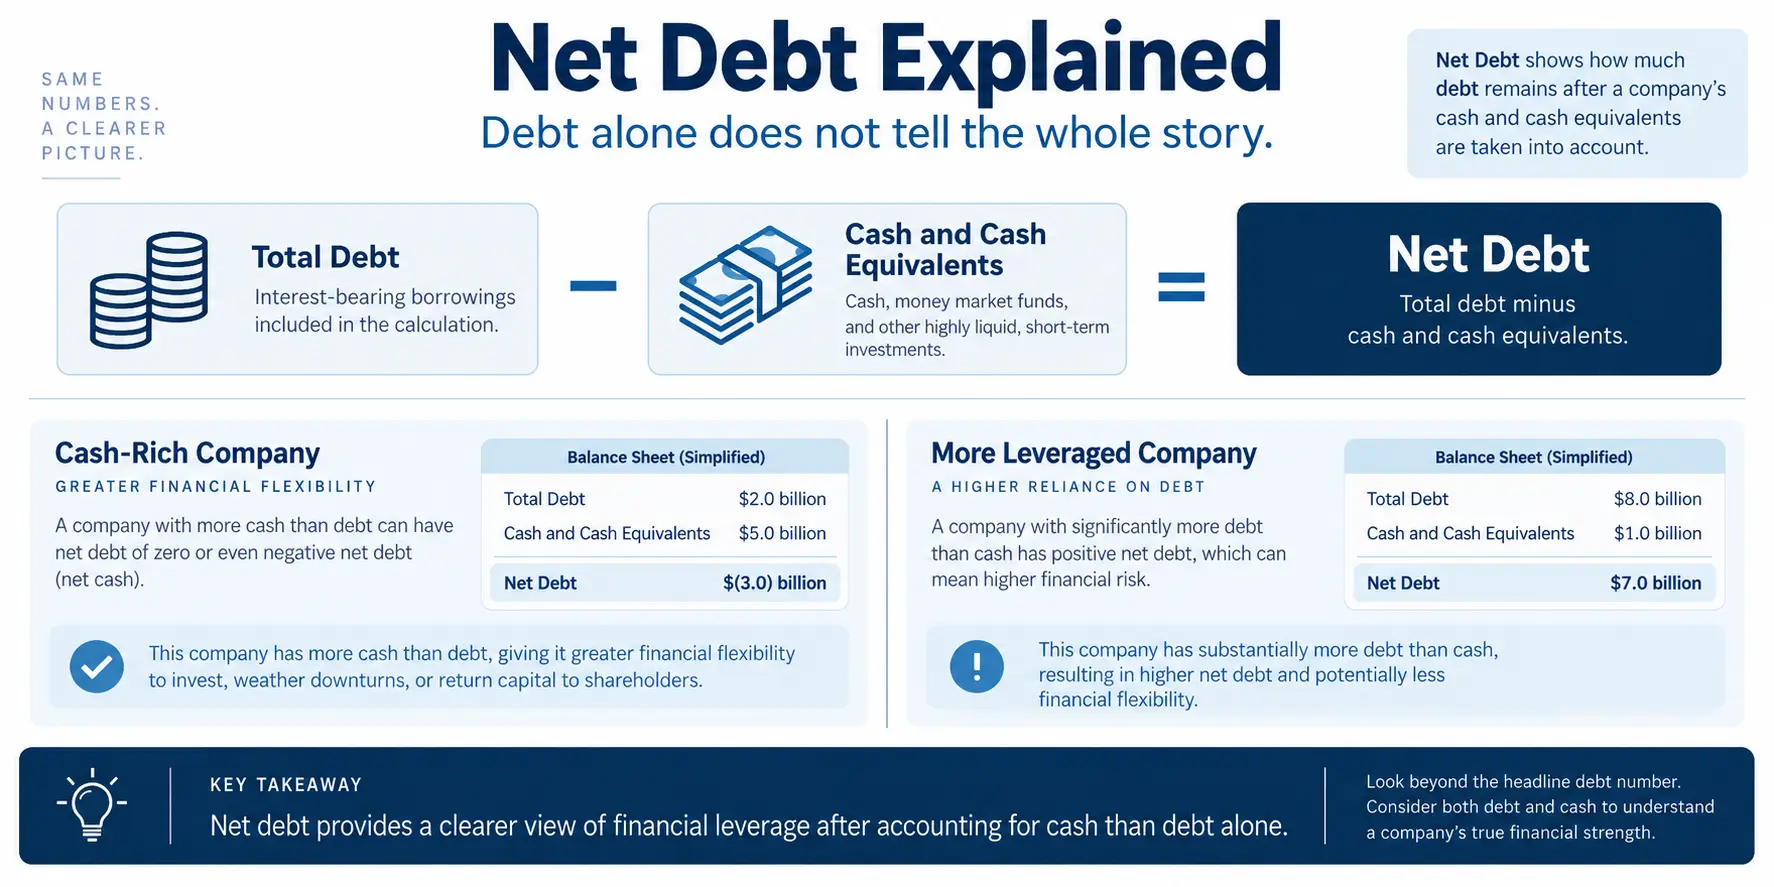
Net debt analysis comparing corporate debt, cash, and financial leverage

A company with a large amount of debt is not automatically in worse financial shape than a peer with less debt. The missing piece is often cash. A business may carry substantial borrowings while also holding enough cash and liquid assets to offset a meaningful portion of those obligations. That is why net debt is … Read more
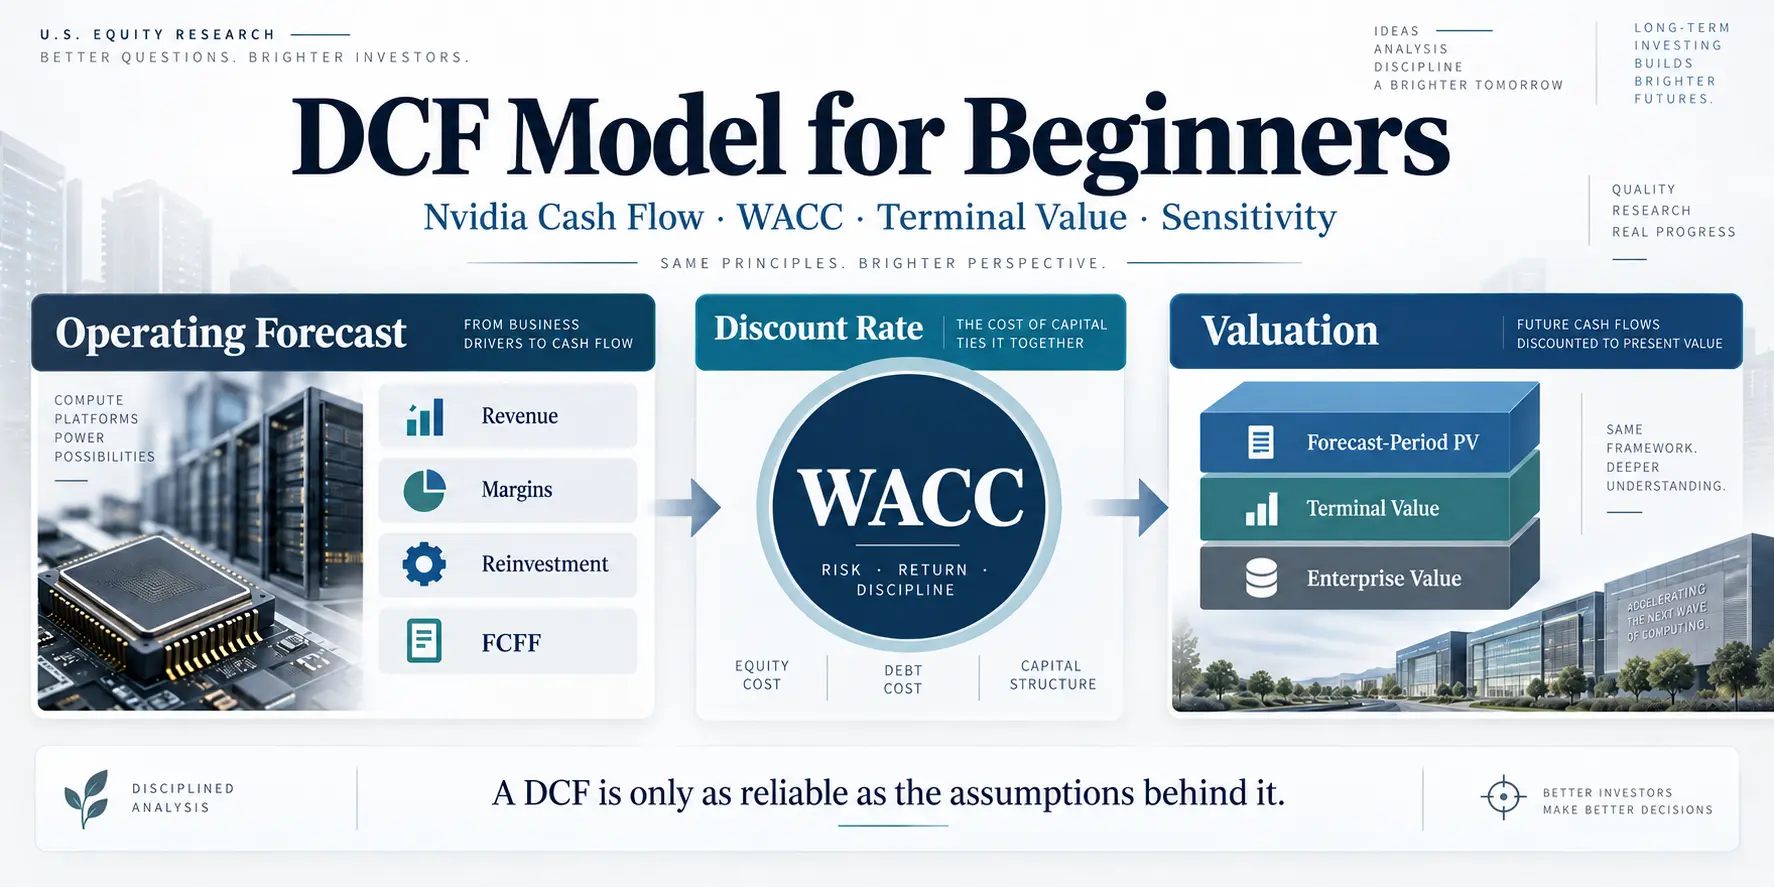
DCF Model for Beginners: Nvidia Cash Flow, WACC, and Terminal Value

DCF model for beginners using Nvidia to explain FCFF, WACC, terminal value, and valuation sensitivity

A DCF model for beginners should start with the cash flow being valued, not with a desired share-price target. Discounted cash flow analysis estimates what a business is worth by projecting future cash flows, discounting them for risk and time, and adding a value for the cash flows expected beyond the explicit forecast period. Nvidia … Read more

ROE vs ROIC: How to Compare Capital Efficiency and Leverage

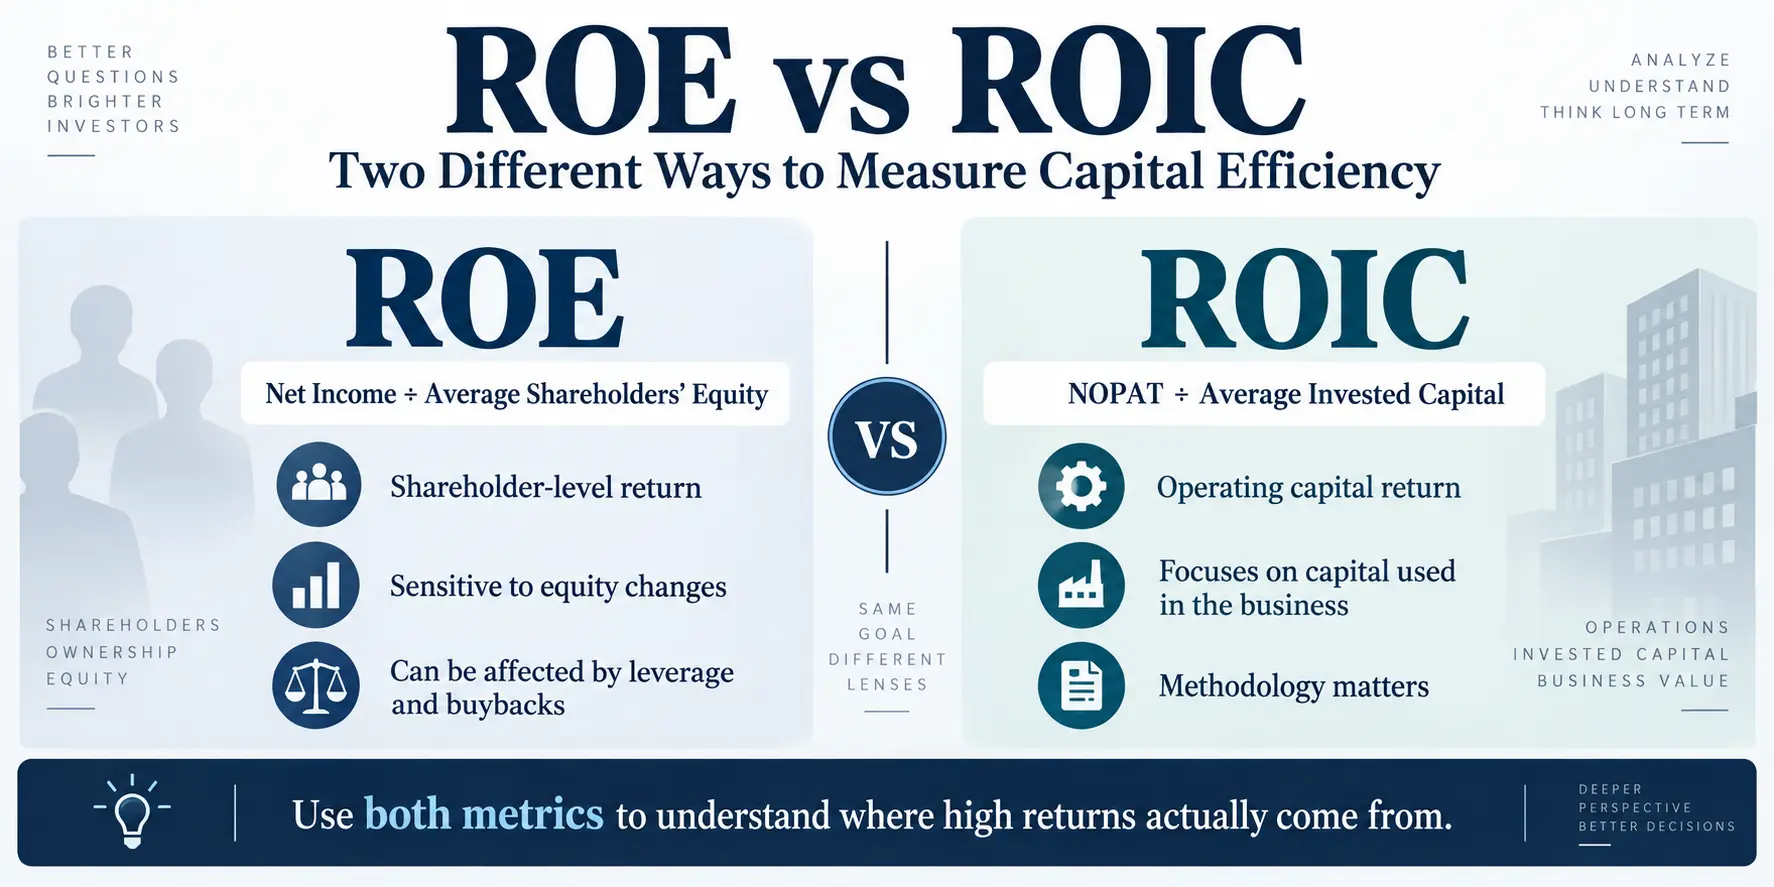
ROE vs ROIC comparison showing shareholder returns, operating capital efficiency, and the role of leverage

ROE vs ROIC helps investors separate shareholder-level profitability from the return generated by the operating capital inside a business. ROE measures net income relative to shareholders’ equity. ROIC instead compares after-tax operating profit with the capital committed to operations. Looking at both can reveal whether a high return comes primarily from strong operating economics or … Read more

Broadcom 200 Day Moving Average: Trend, RSI, and FCF

Broadcom 200 day moving average trendline floor and technical momentum reversal overview

The Broadcom 200 day moving average can help investors evaluate the longer-term direction of AVGO stock, but it cannot establish a guaranteed support price or determine whether the shares are undervalued. A useful Broadcom 200 day moving average analysis combines price trends, RSI momentum, and the company’s operating performance without treating any one indicator as … Read more

Dividend Payout Ratio: Net Income vs. Free Cash Flow

Dividend Payout Ratio Guide infographic highlighting cash flow stability and dividend safety metrics

A dividend payout ratio measures how much of a company’s earnings or cash generation is being returned to shareholders as dividends. The arithmetic is straightforward, but there is no single percentage that can determine dividend safety across every company or industry. The traditional earnings payout ratio and the free cash flow payout ratio answer different … Read more